

Question: In this project, you will apply inference methods for means to test your hypotheses about the housing sales market for a region of the United
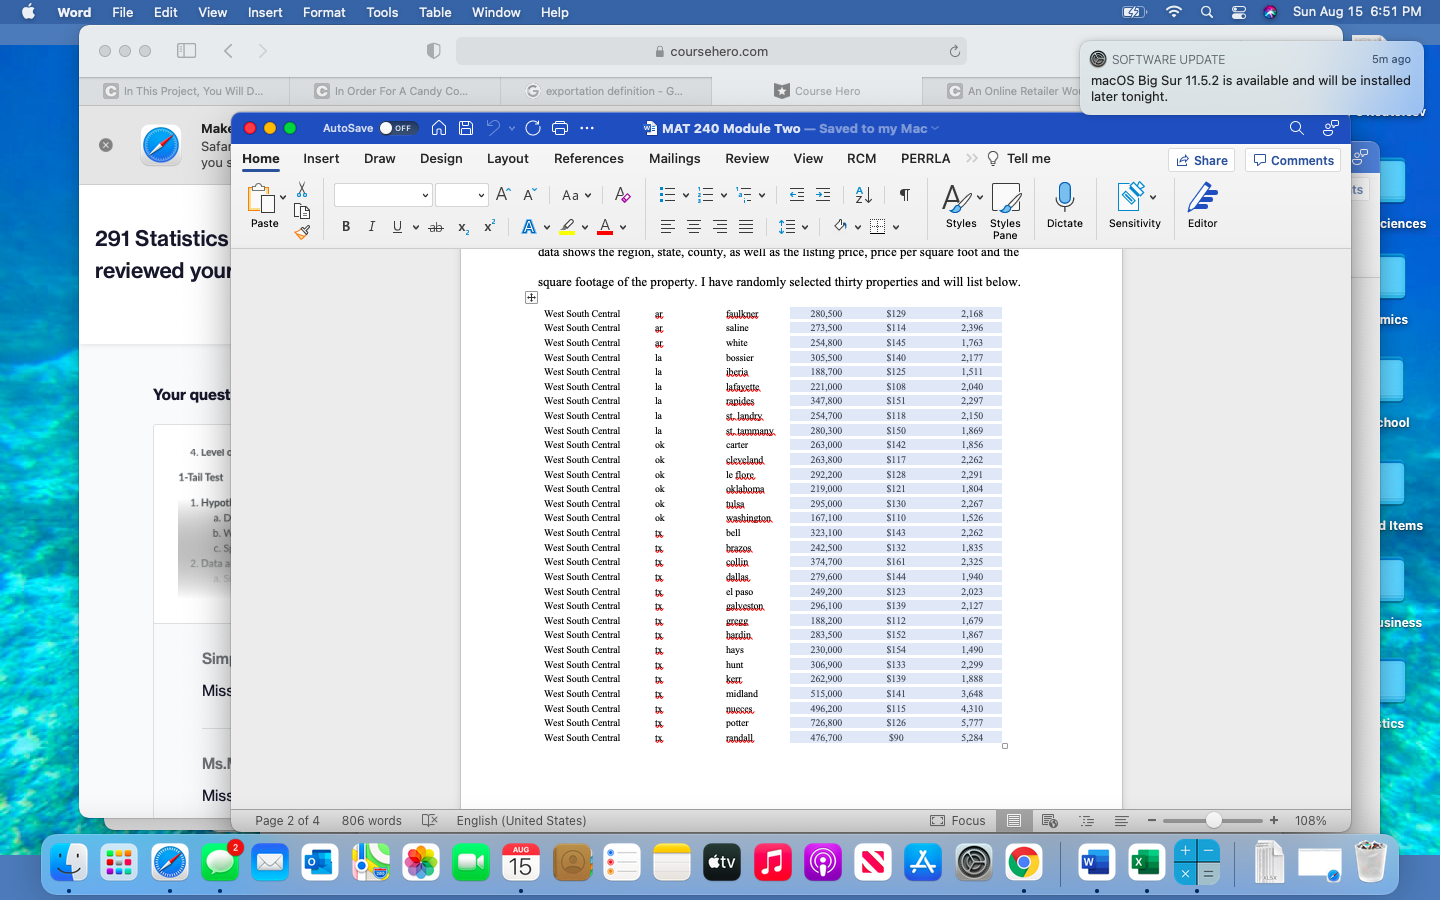
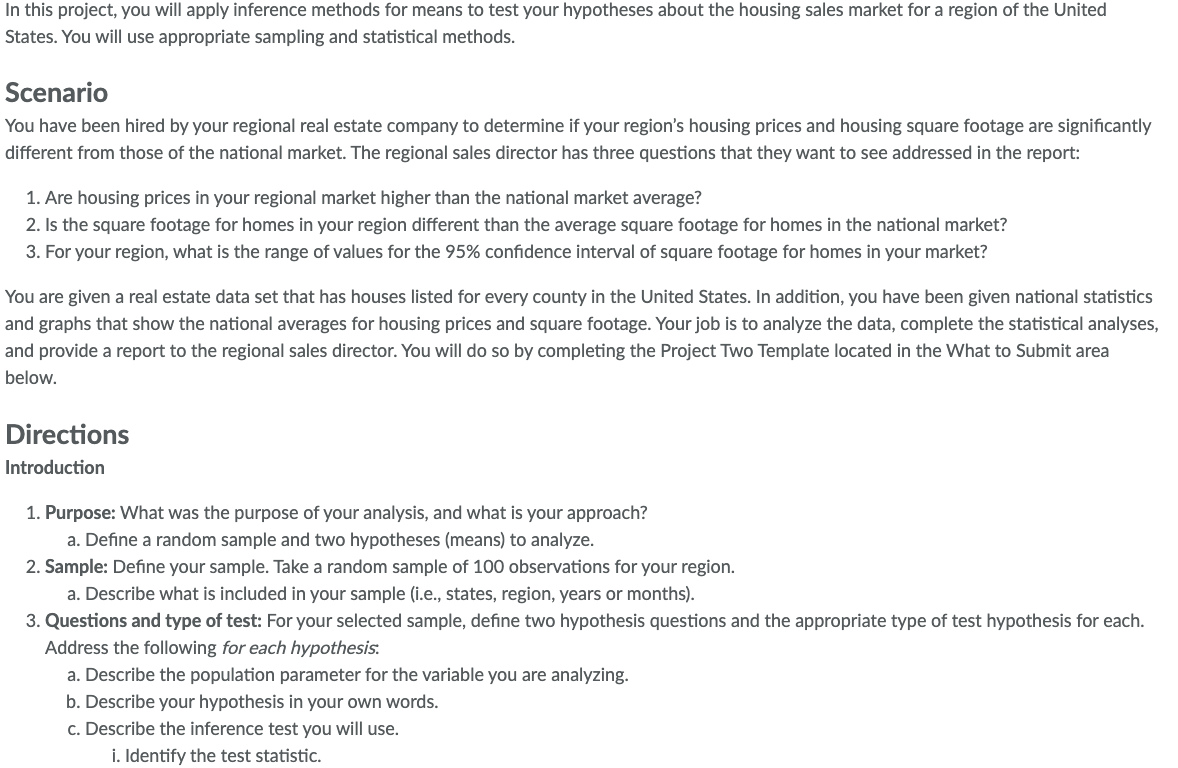
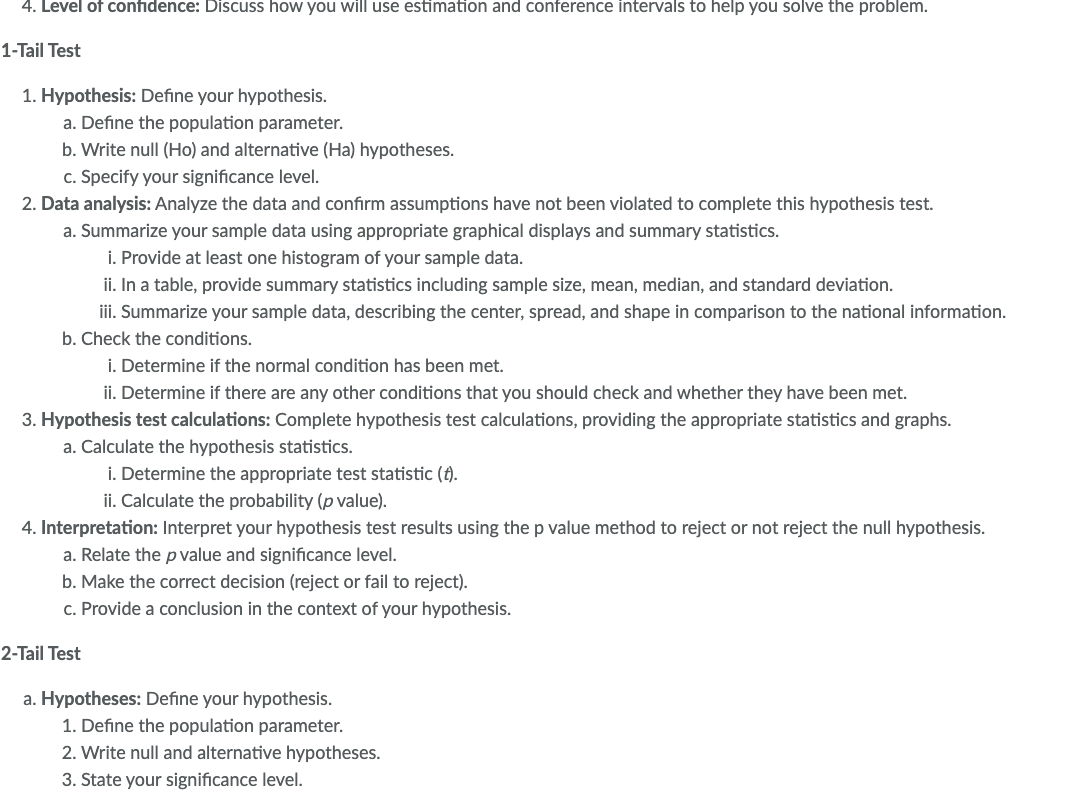


In this project, you will apply inference methods for means to test your hypotheses about the housing sales market for a region of the United States. You will use appropriate sampling and statistical methods. Scenario You have been hired by your regional real estate company to determine if your region's housing prices and housing square footage are significantly different from those of the national market. The regional sales director has three questions that they want to see addressed in the report: 1. Are housing prices in your regional market higher than the national market average? 2. Is the square footage for homes in your region different than the average square footage for homes in the national market? 3. For your region, what is the range of values for the 95% confidence interval of square footage for homes in your market? You are given a real estate data set that has houses listed for every county in the United States. In addition, you have been given national statistics and graphs that show the national averages for housing prices and square footage. Your job is to analyze the data, complete the statistical analyses, and provide a report to the regional sales director. You will do so by completing the Project Two Template located in the What to Submit area below. Directions Introduction 1. Purpose: What was the purpose of your analysis, and what is your approach? a. Define a random sample and two hypotheses (means) to analyze. 2. Sample: Define your sample. Take a random sample of 100 observations for your region. a. Describe what is included in your sample (i.e., states, region, years or months). 3. Questions and type of test: For your selected sample, define two hypothesis questions and the appropriate type of test hypothesis for each. Address the following for each hypothesis. a. Describe the population parameter for the variable you are analyzing. b. Describe your hypothesis in your own words. c. Describe the inference test you will use. i. Identify the test statistic.4. Level of confidence: Discuss how you will use estimation and conference intervals to help you solve the problem. 1-Tail Test 1. Hypothesis: Define your hypothesis. a. Define the population parameter. b. Write null (Ho) and alternative (Ha) hypotheses. c. Specify your significance level. 2. Data analysis: Analyze the data and confirm assumptions have not been violated to complete this hypothesis test. a. Summarize your sample data using appropriate graphical displays and summary statistics. i. Provide at least one histogram of your sample data. ii. In a table, provide summary statistics including sample size, mean, median, and standard deviation. iii. Summarize your sample data, describing the center, spread, and shape in comparison to the national information. b. Check the conditions. i. Determine if the normal condition has been met. ii. Determine if there are any other conditions that you should check and whether they have been met. 3. Hypothesis test calculations: Complete hypothesis test calculations, providing the appropriate statistics and graphs. a. Calculate the hypothesis statistics. i. Determine the appropriate test statistic (4). ii. Calculate the probability (p value). 4. Interpretation: Interpret your hypothesis test results using the p value method to reject or not reject the null hypothesis. a. Relate the p value and significance level. b. Make the correct decision (reject or fail to reject). c. Provide a conclusion in the context of your hypothesis. 2-Tail Test a. Hypotheses: Define your hypothesis. 1. Define the population parameter. 2. Write null and alternative hypotheses. 3. State your significance level.b. Data analysis: Analyze the data and confirm assumptions have not been violated to complete this hypothesis test. a. Summarize your sample data using appropriate graphical displays and summary statistics. i. Provide at least one histogram of your sample data. ii. In a table, provide summary statistics including sample size, mean, median, and standard deviation. iii. Summarize your sample data, describing the center, spread, and shape in comparison to the national information. b. Check the assumptions. i. Determine if the normal condition has been met. ii. Determine if there are any other conditions that should be checked on and whether they have been met. c. Hypothesis test calculations: Complete hypothesis test calculations, providing the appropriate statistics and graphs. a. Calculate the hypothesis statistics. i. Determine the appropriate test statistic (4). ii. Determine the probability (p value). d. Interpretation: Interpret your hypothesis test results using the p value method to reject or not reject the null hypothesis. a. Relate the p value and significance level. b. Make the correct decision (reject or fail to reject). c. Provide a conclusion in the context of your hypothesis. e. Comparison of the test results: See Question 3 from the Scenario section. a. Calculate a 95% confidence interval. Show or describe your method of calculation. b. Interpret a 95% confidence interval. Final Conclusions 1. Summarize your findings: Refer back to the Introduction section above and summarize your findings of the sample you selected. 2. Discuss: Discuss whether you were surprised by the findings. Why or why not?Word File Edit View Insert Format Tools Table Window Help Q 8 Sun Aug 15 6:51 PM [ coursehero.com SOFTWARE UPDATE 5m ago macOS Big Sur 11.5.2 is available and will be installed C In This Project, You Will D.. C In Order For A Candy Co. G exportation definition - G. Course Hero C An Online Retailer Wo later tonight. .. . AutoSave O OFF A A . C G ... MAT 240 Module Two - Saved to my Mac Q Make Safa Home Insert Draw Design Layout References Mailings Review View RCM PERRLA >> ? Tell me Share Comments you s ts " A A Aav Styles Styles Dictate Sensitivity Editor ciences Paste BIUvabX X ALVAv 291 Statistics Pane data shows the region, state, county, as well as the listing price, price per square foot and the reviewed your square footage of the property. I have randomly selected thirty properties and will list below. West South Central faulkner 280,500 $129 2,168 mics West South Central saline 273,500 $114 2.396 West South Central white 254.800 $145 1,763 West South Central bossie 305,500 $140 2.177 West South Central iberia 188,700 $125 1,511 West South Central 221,000 $108 2,040 Your quest West South Central 347,800 $151 2,297 West South Central t landry 254,700 $118 2,150 chool West South Central st tammany. 280,300 $150 1.869 West South Central carter 263,000 $142 1,856 4. Level West South Central cleveland 263,800 2,262 West South Central le flore 292,200 $128 2.291 1-Tail Test West South Central oklahoma 219,000 $121 1.804 1. Hypot West South Central tuls 295,000 $130 2,267 a. D West South Central washington 167,100 $110 1,526 d Items b. W West South Central bell 323,100 $143 2,262 $132 1.835 C. S West South Central brazos 242,500 2. Data a West South Central colli 374,700 $161 2,325 West South Central dallas 279,600 $144 1.940 West South Central I pas 249,20 $123 2,023 West South Central galveston 296,100 $139 2,127 West South Central 188,200 3112 1.679 siness West South Central bardis 283,500 $152 1,867 West South Central hays 230,000 $154 1,490 Sim West South Central hunt 306,900 $133 2,299 West South Central 262,900 $139 1,888 Miss West South Central midland 515,000 $141 3,648 West South Central 496.200 $115 4,310 West South Central potter 726,800 $126 5,737 tics West South Central randall 476,70 $90 5.284 Ms.I Miss Page 2 of 4 806 words s [ English (United States) Focus E - + 108% AUG 4 + - 15 *tv W X =
Step by Step Solution
There are 3 Steps involved in it

Get step-by-step solutions from verified subject matter experts