

Question: In this project, you will reverse engineer an option strategy. You will determine what financial instruments to utilize in order to create the option strategy.
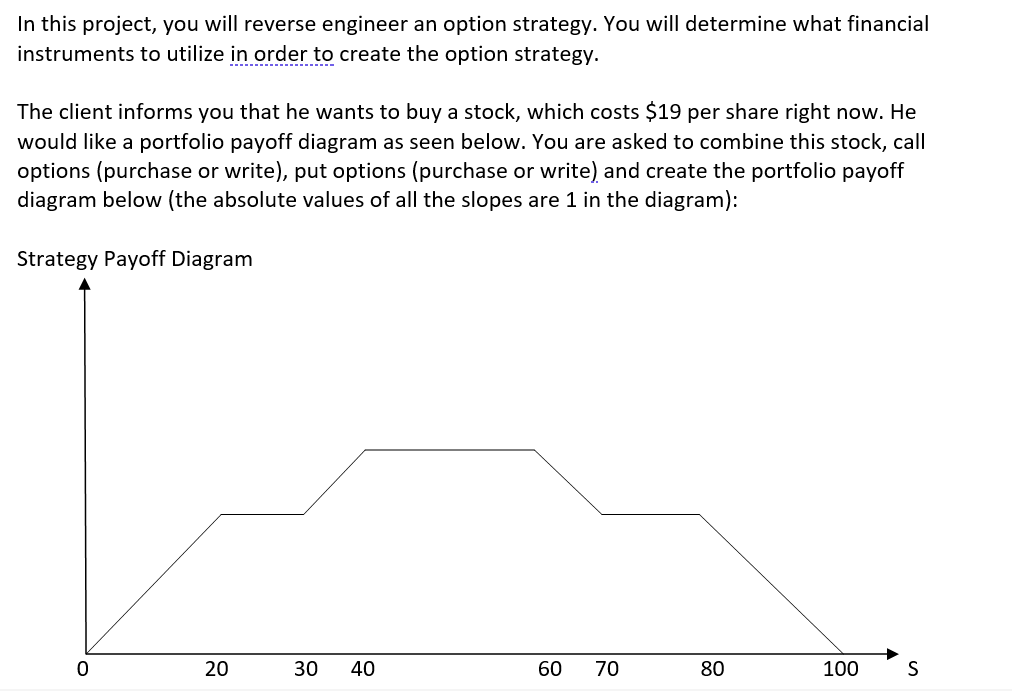
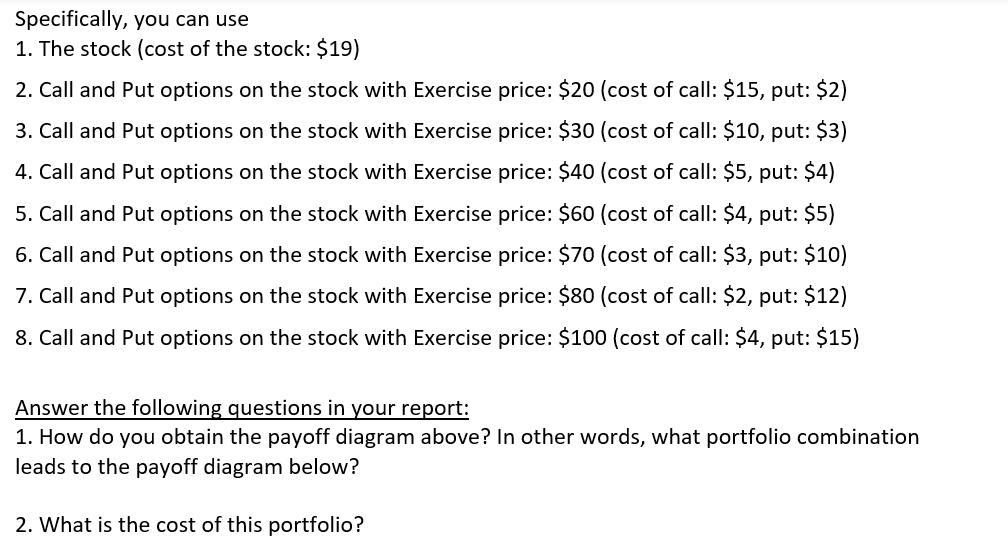
In this project, you will reverse engineer an option strategy. You will determine what financial instruments to utilize in order to create the option strategy. The client informs you that he wants to buy a stock, which costs $19 per share right now. He would like a portfolio payoff diagram as seen below. You are asked to combine this stock, call options (purchase or write), put options (purchase or write) and create the portfolio payoff diagram below (the absolute values of all the slopes are 1 in the diagram): Specifically, you can use 1. The stock (cost of the stock: \$19) 2. Call and Put options on the stock with Exercise price: $20 (cost of call: \$15, put: \$2) 3. Call and Put options on the stock with Exercise price: \$30 (cost of call: \$10, put: \$3) 4. Call and Put options on the stock with Exercise price: $40 (cost of call: $5, put: \$4) 5. Call and Put options on the stock with Exercise price: $60 (cost of call: $4, put: \$5) 6. Call and Put options on the stock with Exercise price: $70 (cost of call: $3, put: \$10) 7. Call and Put options on the stock with Exercise price: $80 (cost of call: \$2, put: \$12) 8. Call and Put options on the stock with Exercise price: \$100 (cost of call: \$4, put: \$15) Answer the following questions in your report: 1. How do you obtain the payoff diagram above? In other words, what portfolio combination leads to the payoff diagram below? 2. What is the cost of this portfolio? In this project, you will reverse engineer an option strategy. You will determine what financial instruments to utilize in order to create the option strategy. The client informs you that he wants to buy a stock, which costs $19 per share right now. He would like a portfolio payoff diagram as seen below. You are asked to combine this stock, call options (purchase or write), put options (purchase or write) and create the portfolio payoff diagram below (the absolute values of all the slopes are 1 in the diagram): Specifically, you can use 1. The stock (cost of the stock: \$19) 2. Call and Put options on the stock with Exercise price: $20 (cost of call: \$15, put: \$2) 3. Call and Put options on the stock with Exercise price: \$30 (cost of call: \$10, put: \$3) 4. Call and Put options on the stock with Exercise price: $40 (cost of call: $5, put: \$4) 5. Call and Put options on the stock with Exercise price: $60 (cost of call: $4, put: \$5) 6. Call and Put options on the stock with Exercise price: $70 (cost of call: $3, put: \$10) 7. Call and Put options on the stock with Exercise price: $80 (cost of call: \$2, put: \$12) 8. Call and Put options on the stock with Exercise price: \$100 (cost of call: \$4, put: \$15) Answer the following questions in your report: 1. How do you obtain the payoff diagram above? In other words, what portfolio combination leads to the payoff diagram below? 2. What is the cost of this portfolio
Step by Step Solution
There are 3 Steps involved in it

Get step-by-step solutions from verified subject matter experts