

Question: In this project you will write a program to produce a discrete event simulation of a network of 2 input and 1 output switching elements
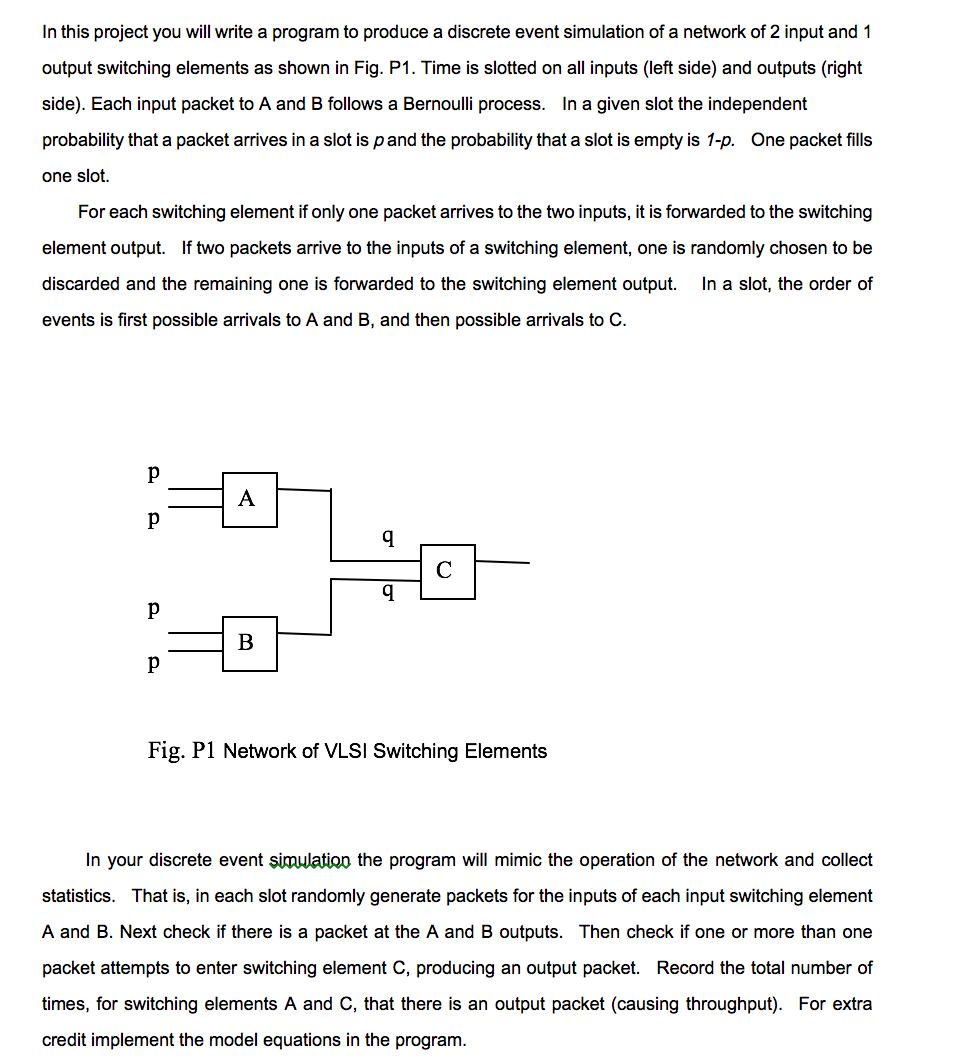
In this project you will write a program to produce a discrete event simulation of a network of 2 input and 1 output switching elements as shown in Fig. P1. Time is slotted on all inputs (left side) and outputs (right side). Each input packet to A and B follows a Bernoulli process. In a given slot the independent probability that a packet arrives in a slot is p and the probability that a slot is empty is 1-p. One packet fills one slot. For each switching element if only one packet arrives to the two inputs, it is forwarded to the switching element output. If two packets arrive to the inputs of a switching element, one is randomly chosen to be discarded and the remaining one is forwarded to the switching element output. In a slot, the order of events is first possible arrivals to A and B, and then possible arrivals to C. Fig. P1 Network of VLSI Switching Elements In your discrete event simulation the program will mimic the operation of the network and collect statistics. That is, in each slot randomly generate packets for the inputs of each input switching element A and B. Next check if there is a packet at the A and B outputs. Then check if one or more than one packet attempts to enter switching element C, producing an output packet. Record the total number of times, for switching elements A and C, that there is an output packet (causing throughput). For extra credit implement the model equations in the program. As a function of p (pr.02, .04 up to 1.0 in steps of 0.02), plot (label clearly) the fraction of time spent in a useful (normalized) throughput both element A and C switching element outputs. Normalized throughput is the total number of output packets for a switching element divided by the total number of slots. The program outer loop should involve the next inner loop should involve the number of slots simulated for each value of p (do at least a thousand slots). The more simulated slots, the more accurate the results and the smoother the curves will be. Source Code (with name of the language/package used) including flow chart and brief description of the program. Flow chart should be 6-12 boxes and not be overly detailed giving an overview of program operation. The program can be written in any language. 2. Two well labeled visualization graphs showing the throughput for elements A and C vs. probability p. If you plot both the simulation and theoretical equations be sure it is clearly indicated that you plotted both curves since they will be close/identical - list the equations in the report if you plot them, In this project you will write a program to produce a discrete event simulation of a network of 2 input and 1 output switching elements as shown in Fig. P1. Time is slotted on all inputs (left side) and outputs (right side). Each input packet to A and B follows a Bernoulli process. In a given slot the independent probability that a packet arrives in a slot is p and the probability that a slot is empty is 1-p. One packet fills one slot. For each switching element if only one packet arrives to the two inputs, it is forwarded to the switching element output. If two packets arrive to the inputs of a switching element, one is randomly chosen to be discarded and the remaining one is forwarded to the switching element output. In a slot, the order of events is first possible arrivals to A and B, and then possible arrivals to C. Fig. P1 Network of VLSI Switching Elements In your discrete event simulation the program will mimic the operation of the network and collect statistics. That is, in each slot randomly generate packets for the inputs of each input switching element A and B. Next check if there is a packet at the A and B outputs. Then check if one or more than one packet attempts to enter switching element C, producing an output packet. Record the total number of times, for switching elements A and C, that there is an output packet (causing throughput). For extra credit implement the model equations in the program. As a function of p (pr.02, .04 up to 1.0 in steps of 0.02), plot (label clearly) the fraction of time spent in a useful (normalized) throughput both element A and C switching element outputs. Normalized throughput is the total number of output packets for a switching element divided by the total number of slots. The program outer loop should involve the next inner loop should involve the number of slots simulated for each value of p (do at least a thousand slots). The more simulated slots, the more accurate the results and the smoother the curves will be. Source Code (with name of the language/package used) including flow chart and brief description of the program. Flow chart should be 6-12 boxes and not be overly detailed giving an overview of program operation. The program can be written in any language. 2. Two well labeled visualization graphs showing the throughput for elements A and C vs. probability p. If you plot both the simulation and theoretical equations be sure it is clearly indicated that you plotted both curves since they will be close/identical - list the equations in the report if you plot them
Step by Step Solution
There are 3 Steps involved in it

Get step-by-step solutions from verified subject matter experts