

Question: In this question, you will be presented with a graphic plot, and code that creates a graphic that doesnt quite accomplish the goal. Your objective
In this question, you will be presented with a graphic plot, and code that creates a graphic that doesnt quite accomplish the goal. Your objective is to modify the incorrect code until it creates the desired plot. 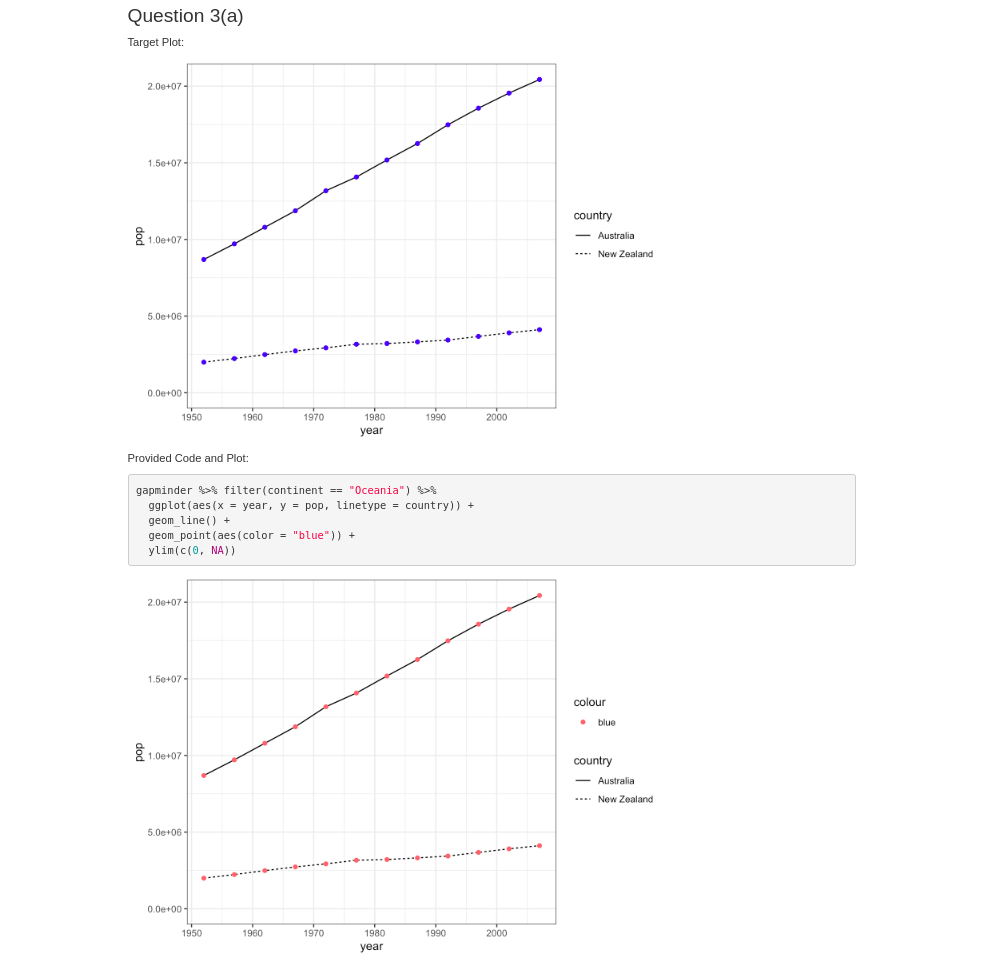
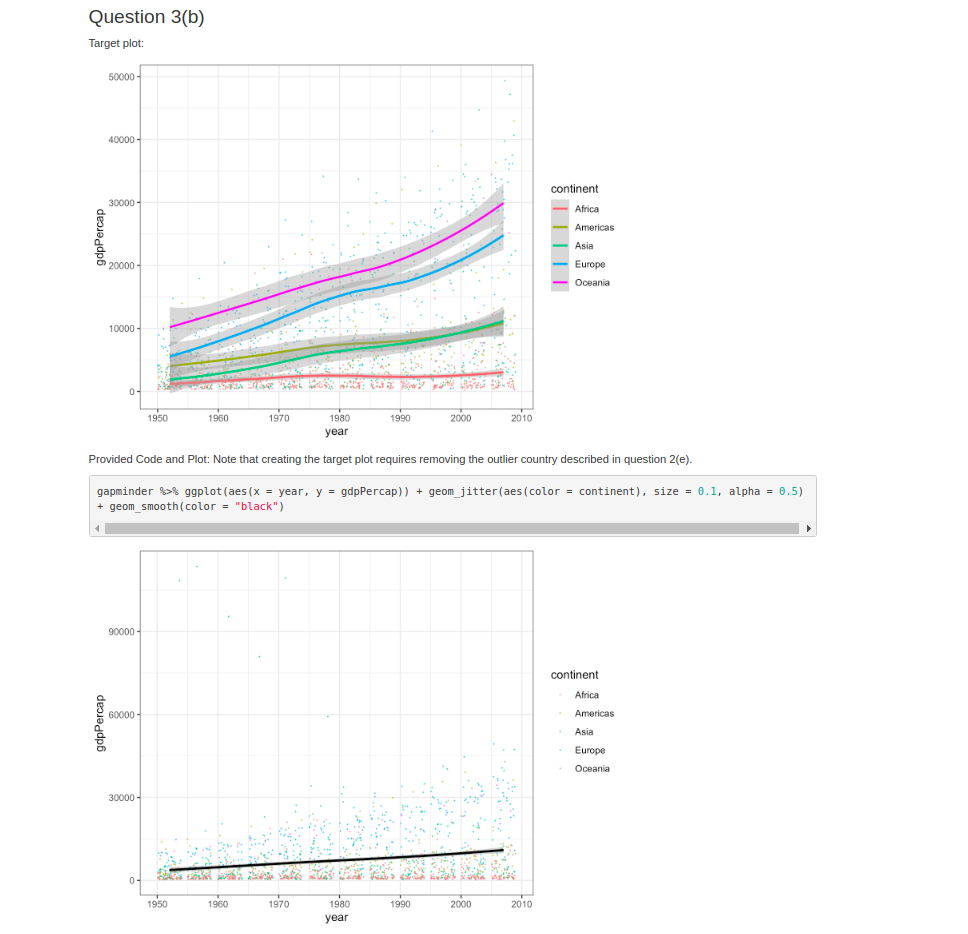
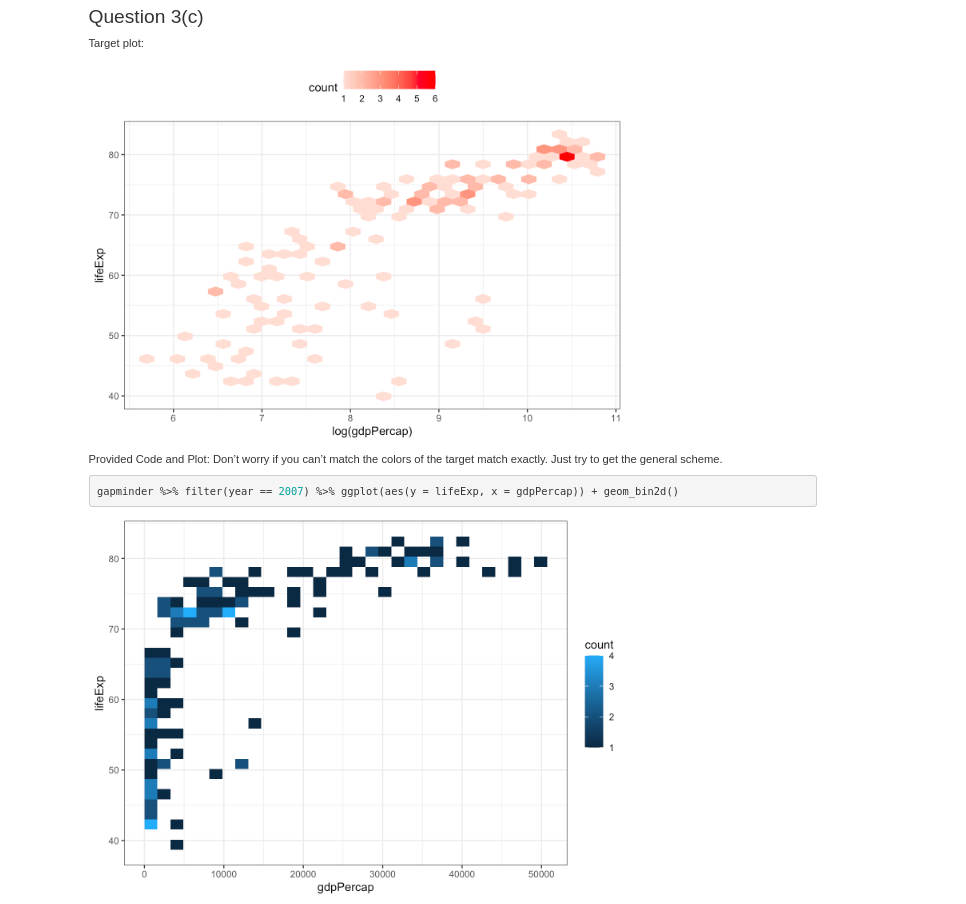
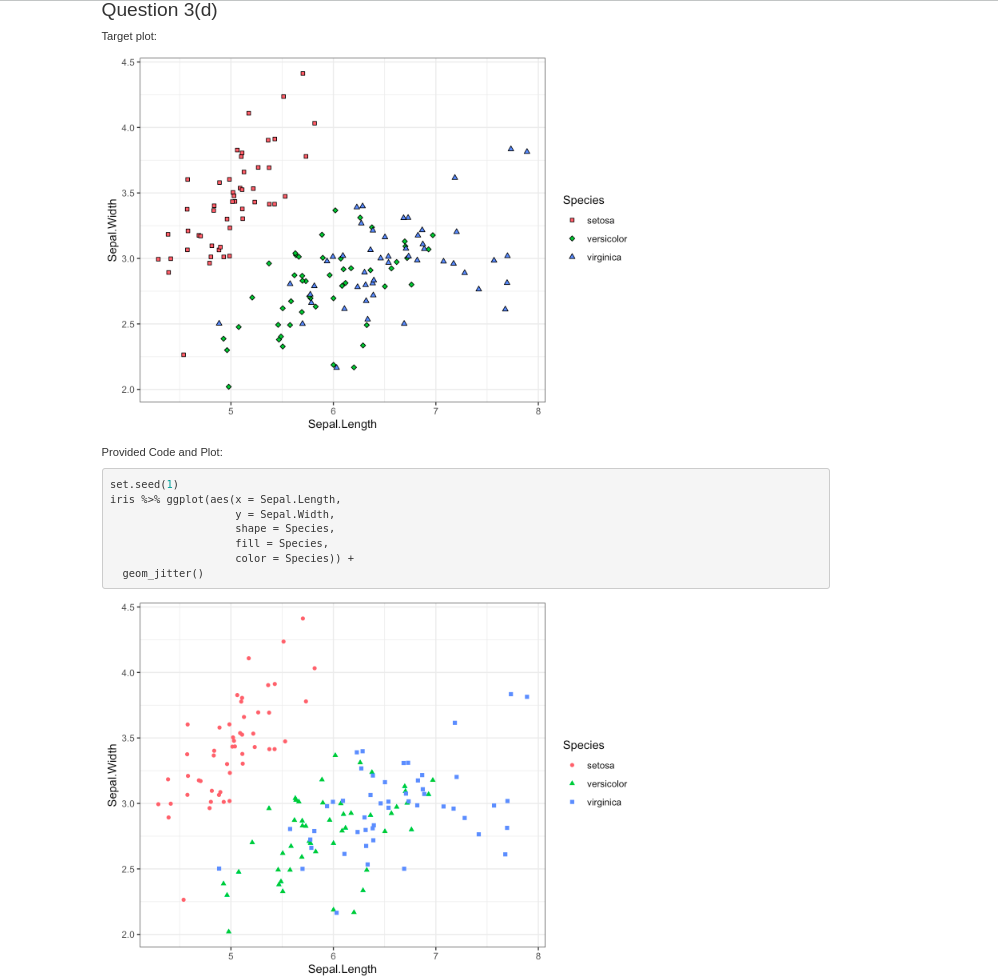
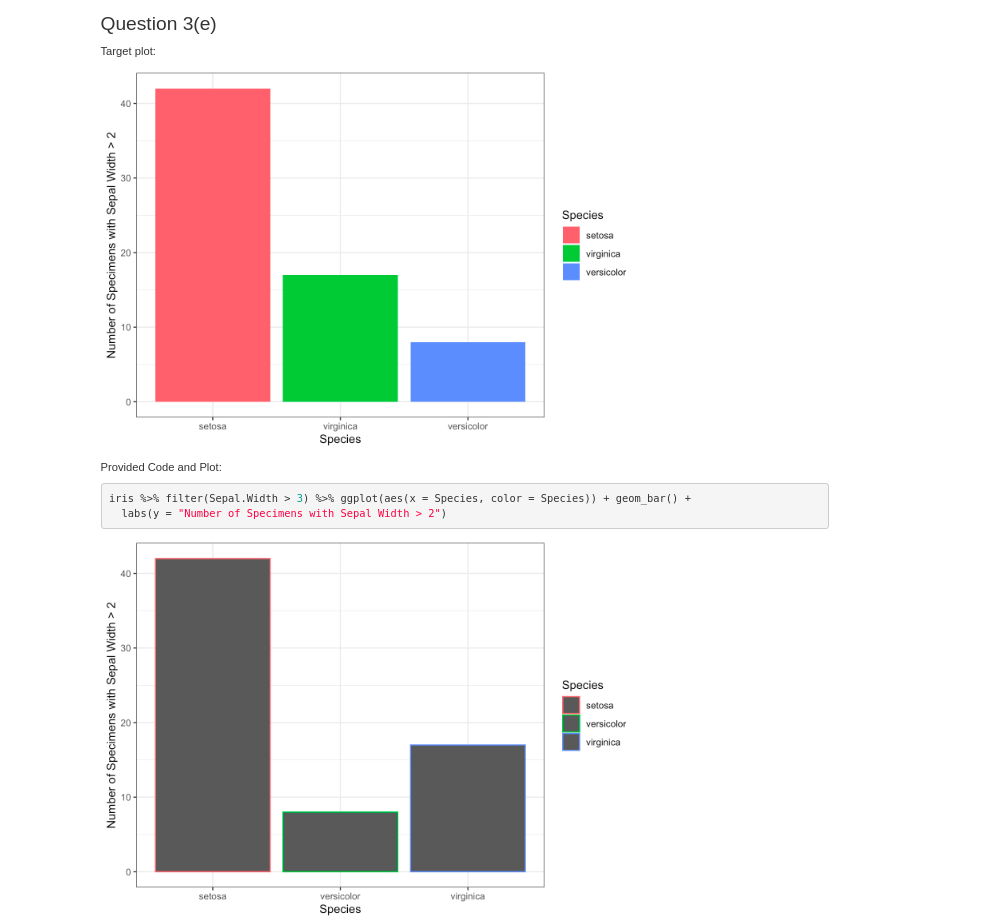
Question 3(a) Target Plot: Provided Code and Plot: gapminder s>s filter ( continent == "Oceania" ) sss ggplot ( aes (x= year, y= pop, linetype = country ))+ geom_line ()+ geom_point ( aes ( color = "blue" ))+ ylim (c(0,NA)) Question 3(b) Tarqet plot: Provided Code and Plot: Note that creating the target plot requires removing the outlier country described in question 2(e). gapminder s > ggplot ( aes (x= year, y= gdpPercap ))+ geom_jitter (aes( color = continent ), size =.1, alpha =0.5) + geom_smooth ( color = "black") Question 3(c) Target plot: Question 3(d) Taroet olot: Question 3(e) Target plot: Provided Code and Plot: iris&>%filter(Sepal.Width>3)&>%ggplot(aes(x=Species,color=Species))+geombar()+labs(y="NumberofSpecimenswithSepalWidth>2") Question 3(a) Target Plot: Provided Code and Plot: gapminder s>s filter ( continent == "Oceania" ) sss ggplot ( aes (x= year, y= pop, linetype = country ))+ geom_line ()+ geom_point ( aes ( color = "blue" ))+ ylim (c(0,NA)) Question 3(b) Tarqet plot: Provided Code and Plot: Note that creating the target plot requires removing the outlier country described in question 2(e). gapminder s > ggplot ( aes (x= year, y= gdpPercap ))+ geom_jitter (aes( color = continent ), size =.1, alpha =0.5) + geom_smooth ( color = "black") Question 3(c) Target plot: Question 3(d) Taroet olot: Question 3(e) Target plot: Provided Code and Plot: iris&>%filter(Sepal.Width>3)&>%ggplot(aes(x=Species,color=Species))+geombar()+labs(y="NumberofSpecimenswithSepalWidth>2")
Step by Step Solution
There are 3 Steps involved in it

Get step-by-step solutions from verified subject matter experts