

Question: In this question you will evaluate and test asset-pricing models using the time-series framework. The most difficult part is the Gibbons, Ross and Shanken (1989,
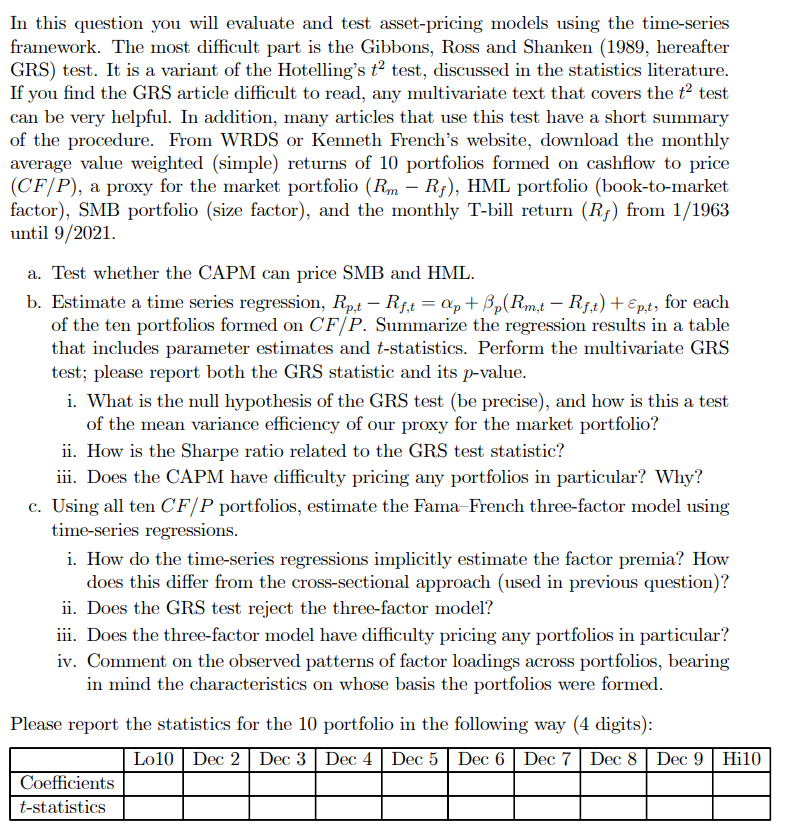
In this question you will evaluate and test asset-pricing models using the time-series framework. The most difficult part is the Gibbons, Ross and Shanken (1989, hereafter GRS) test. It is a variant of the Hotelling's t2 test, discussed in the statistics literature. If you find the GRS article difficult to read, any multivariate text that covers the t2 test can be very helpful. In addition, many articles that use this test have a short summary of the procedure. From WRDS or Kenneth French's website, download the monthly average value weighted (simple) returns of 10 portfolios formed on cashflow to price (CF/P), a proxy for the market portfolio (Rm Rf), HML portfolio (book-to-market factor), SMB portfolio (size factor), and the monthly T-bill return (Rp) from 1/1963 until 9/2021. a. Test whether the CAPM can price SMB and HML. b. Estimate a time series regression, Rp,t Rf,t = Ap + Bp(Rm,t Rf,t) +Ep,t, for each of the ten portfolios formed on CF/P. Summarize the regression results in a table that includes parameter estimates and t-statistics. Perform the multivariate GRS test; please report both the GRS statistic and its p-value. i. What is the null hypothesis of the GRS test (be precise), and how is this a test of the mean variance efficiency of our proxy for the market portfolio? ii. How is the Sharpe ratio related to the GRS test statistic? ii. Does the CAPM have difficulty pricing any portfolios in particular? Why? c. Using all ten CF/P portfolios, estimate the Fama French three-factor model using time-series regressions. i. How do the time-series regressions implicitly estimate the factor premia? How does this differ from the cross-sectional approach (used in previous question)? ii. Does the GRS test reject the three-factor model? iii. Does the three-factor model have difficulty pricing any portfolios in particular? iv. Comment on the observed patterns of factor loadings across portfolios, bearing in mind the characteristics on whose basis the portfolios were formed. Please report the statistics for the 10 portfolio in the following way (4 digits): Lo10 Dec 2 Dec 3 Dec 4 Dec 5 Dec 6 Dec 7 Dec 8 Dec 9 Hi10 Coefficients t-statistics In this question you will evaluate and test asset-pricing models using the time-series framework. The most difficult part is the Gibbons, Ross and Shanken (1989, hereafter GRS) test. It is a variant of the Hotelling's t2 test, discussed in the statistics literature. If you find the GRS article difficult to read, any multivariate text that covers the t2 test can be very helpful. In addition, many articles that use this test have a short summary of the procedure. From WRDS or Kenneth French's website, download the monthly average value weighted (simple) returns of 10 portfolios formed on cashflow to price (CF/P), a proxy for the market portfolio (Rm Rf), HML portfolio (book-to-market factor), SMB portfolio (size factor), and the monthly T-bill return (Rp) from 1/1963 until 9/2021. a. Test whether the CAPM can price SMB and HML. b. Estimate a time series regression, Rp,t Rf,t = Ap + Bp(Rm,t Rf,t) +Ep,t, for each of the ten portfolios formed on CF/P. Summarize the regression results in a table that includes parameter estimates and t-statistics. Perform the multivariate GRS test; please report both the GRS statistic and its p-value. i. What is the null hypothesis of the GRS test (be precise), and how is this a test of the mean variance efficiency of our proxy for the market portfolio? ii. How is the Sharpe ratio related to the GRS test statistic? ii. Does the CAPM have difficulty pricing any portfolios in particular? Why? c. Using all ten CF/P portfolios, estimate the Fama French three-factor model using time-series regressions. i. How do the time-series regressions implicitly estimate the factor premia? How does this differ from the cross-sectional approach (used in previous question)? ii. Does the GRS test reject the three-factor model? iii. Does the three-factor model have difficulty pricing any portfolios in particular? iv. Comment on the observed patterns of factor loadings across portfolios, bearing in mind the characteristics on whose basis the portfolios were formed. Please report the statistics for the 10 portfolio in the following way (4 digits): Lo10 Dec 2 Dec 3 Dec 4 Dec 5 Dec 6 Dec 7 Dec 8 Dec 9 Hi10 Coefficients t-statistics
Step by Step Solution
There are 3 Steps involved in it

Get step-by-step solutions from verified subject matter experts