

Question: in thousands, except per share data Period Ending Operating Revenue Percent change in Revenue Cost of Revenue Percent change in COGS Gross Profit Percent
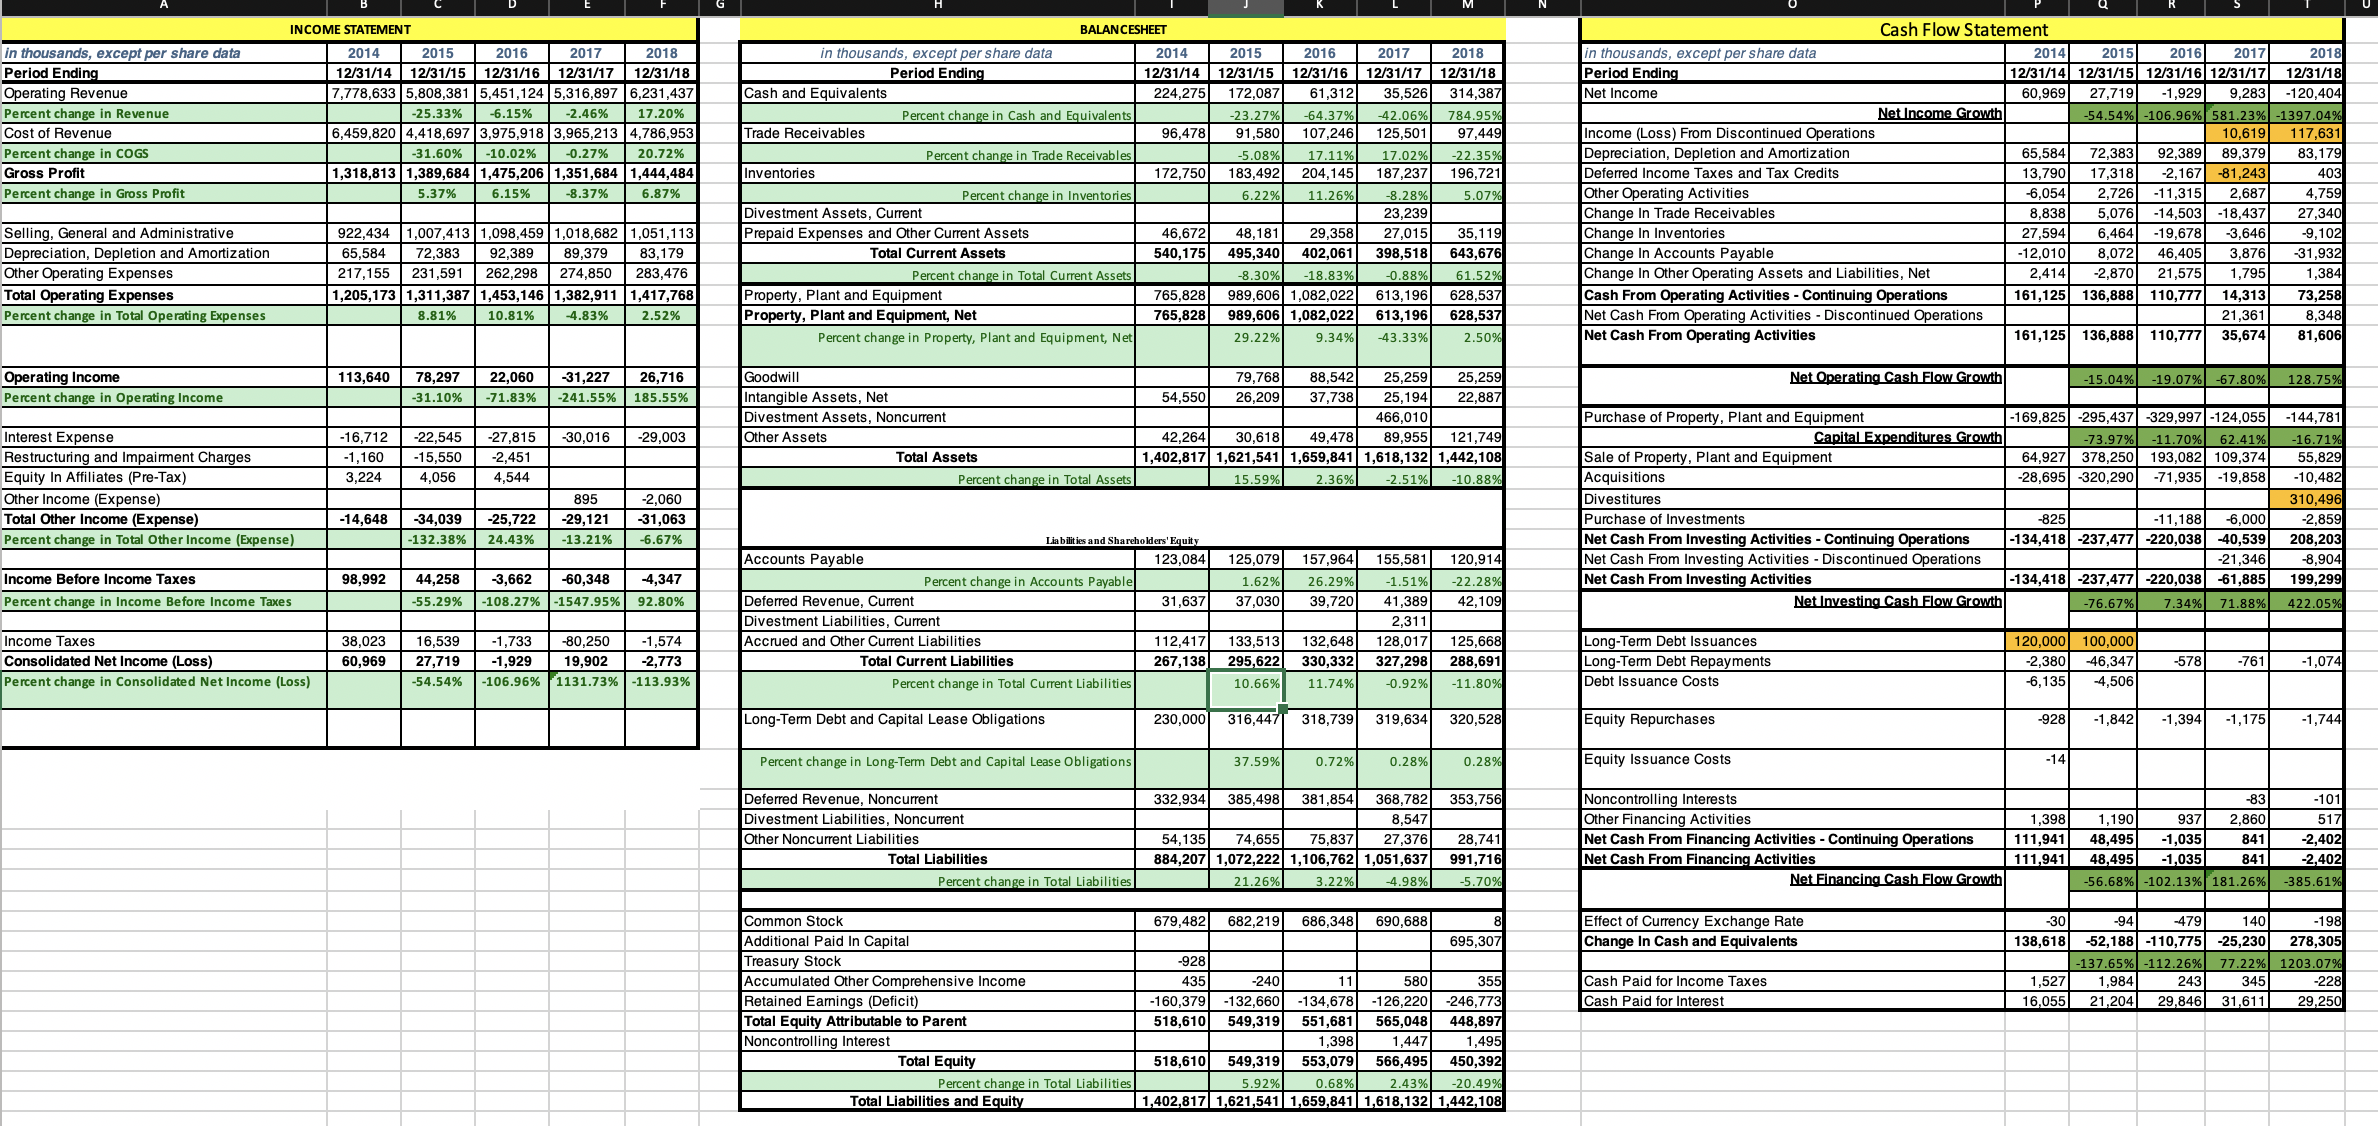
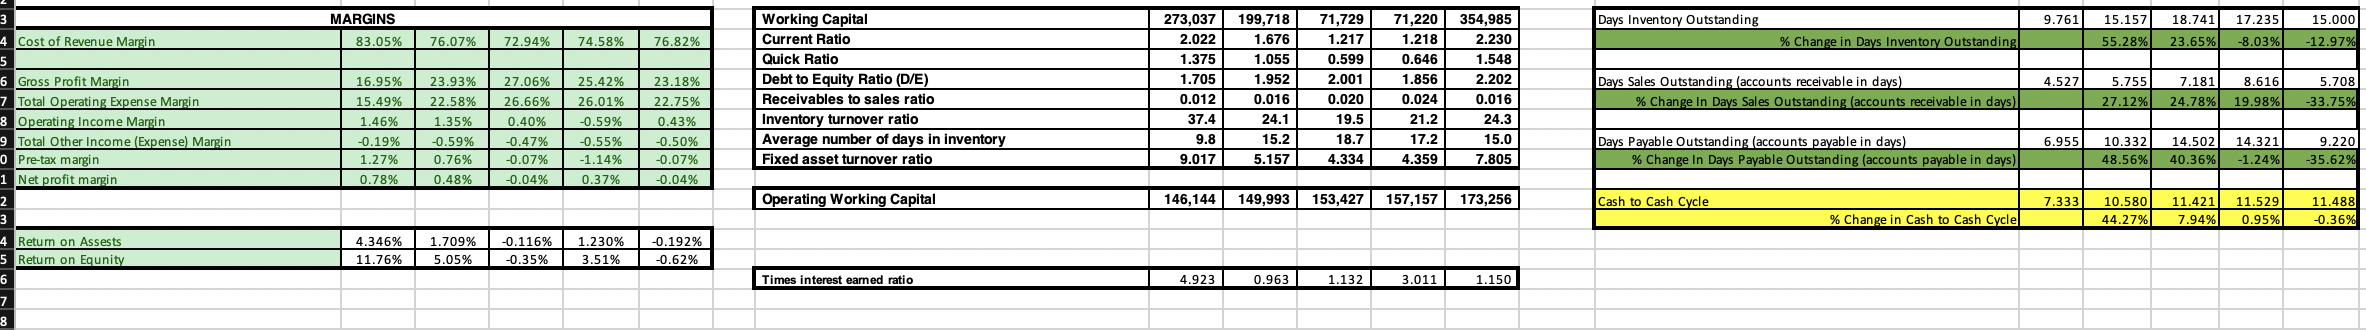
in thousands, except per share data Period Ending Operating Revenue Percent change in Revenue Cost of Revenue Percent change in COGS Gross Profit Percent change in Gross Profit INCOME STATEMENT 2014 2015 2016 2017 2018 12/31/14 12/31/15 12/31/16 12/31/17 12/31/18 7,778,633 5,808,381 5,451,124 5,316,897 6,231,437 -25.33% -6.15% -2.46% 17.20% 6,459,820 4,418,697 3,975,918 3,965,213 4,786,953 -31.60% -10.02% -0.27% 20.72% 1,318,813 1,389,684 | 1,475,206 1,351,684 1,444,484 5.37% 6.15% -8.37% 6.87% BALANCESHEET Cash Flow Statement in thousands, except per share data Period Ending Cash and Equivalents Percent change in Cash and Equivalents Trade Receivables Percent change in Trade Receivables Inventories Percent change in Inventories 2014 2015 2016 2017 2018 12/31/14 12/31/15 12/31/16 12/31/17 12/31/18 224,275 172,087 61,312 35,526 314,387 -23.27% -64.37% -42.06% 784.95% 96,478 91,580 107,246 125,501 97,449 -5.08% 17.11% 17.02% -22.35% 172,750 183,492 204,145 187,237 196,721 6.22% 11.26% 5.07% in thousands, except per share data Period Ending Net Income Net Income Growth Selling, General and Administrative Depreciation, Depletion and Amortization Other Operating Expenses Total Operating Expenses Percent change in Total Operating Expenses 922,434 1,007,413 1,098,459 1,018,682 1,051,113 65,584 72,383 92,389 89,379 83,179 217,155 231,591 262,298 274,850 283,476 1,205,173 1,311,387 1,453,146 1,382,911 1,417,768 8.81% 10.81% -4.83% 2.52% Divestment Assets, Current Prepaid Expenses and Other Current Assets Total Current Assets Percent change in Total Current Assets Property, Plant and Equipment Property, Plant and Equipment, Net 765,828 765,828 Percent change in Property, Plant and Equipment, Net -8.28% 23,239 46,672 48,181 29,358 27,015 35,119 540,175 495,340 402,061 398,518 643,676 -8.30% -18.83% -0.88% 61.52% 989,606 1,082,022 613,196 628,537 989,606 1,082,022 613,196 628,537 29.22% 9.34% -43.33% 2.50% Income (Loss) From Discontinued Operations Depreciation, Depletion and Amortization Deferred Income Taxes and Tax Credits Other Operating Activities Change In Trade Receivables 2014 2015 2016 2017 12/31/14 12/31/15 12/31/16 12/31/17 12/31/18 60,969 27,719 -1,929 9,283 -120,404 -54.54% -106.96% 581.23% -1397.04% 10,619 117,631 65,584 72,383 92,389 89,379 83,179 13,790 17,318 -2,167 -81,243 -6,054 2,726 -11,315 2,687 8,838 2018 5,076 -14,503 -18,437 403 4,759 27,340 Change In Inventories 27,594 Change In Accounts Payable -12,010 Change In Other Operating Assets and Liabilities, Net Cash From Operating Activities - Continuing Operations Net Cash From Operating Activities Discontinued Operations Net Cash From Operating Activities 6,464 -19,678 -3,646 -9,102 8,072 46,405 3,876 -31,932 2,414 -2,870 21,575 1,795 1,384 161,125 136,888 110,777 14,313 73,258 21,361 8,348 161,125 136,888 110,777 35,674 81,606 Operating Income Percent change in Operating Income Interest Expense 113,640 78,297 22,060 -31,227 26,716 -31.10% -71.83% -241.55% 185.55% Goodwill Intangible Assets, Net 54,550 Divestment Assets, Noncurrent Restructuring and Impairment Charges Equity In Affiliates (Pre-Tax) 3,224 4.056 -16,712 -22,545 -27,815 -30,016 -1,160 -15,550 -2,451 4,544 -29.003 Other Assets Total Assets Percent change in Total Assets 15.59% 79,768 88,542 25,259 25,259 26,209 37,738 25,194 22,887 466,010 42,264 30,618 49,478 89,955 121,749 1,402,817 1,621,541 1,659,841 1,618,132 1,442,108 -2.51% -10.88% Net Operating Cash Flow Growth -15.04% -19.07% -67.80% 128.75% Purchase of Property, Plant and Equipment Capital Expenditures Growth 2.36% Sale of Property, Plant and Equipment Acquisitions -169,825 -295,437 -329,997 -124,055 -144,781 -73.97% -11.70% 62.41% -16.71% 64,927 378,250 193,082 109,374 55,829 -28,695 -320,290 -71,935 -19,858 -10,482 Other Income (Expense) Total Other Income (Expense) Percent change in Total Other Income (Expense) -14,648 -34,039 -25,722 -132.38% 24.43% -13.21% 895 -2,060 -29,121 -31,063 -6.67% Divestitures Purchase of Investments Liabilities and Shareholders' Equity Accounts Payable 123,084 Income Before Income Taxes 98,992 Percent change in Income Before Income Taxes 44,258 -55.29% -3,662 -60,348 -108.27% -1547.95% -4,347 92.80% Percent change in Accounts Payable Income Taxes Consolidated Net Income (Loss) Percent change in Consolidated Net Income (Loss) 38,023 16,539 -1,733 -80,250 -1,574 60,969 27,719 -1,929 19,902 -2,773 -54.54% -106.96% 1131.73% -113.93% Deferred Revenue, Current Divestment Liabilities, Current Accrued and Other Current Liabilities 31,637 125,079 1.62% 37,030 157,964 155,581 120,914 26.29% -1.51% -22.28% Net Cash From Investing Activities - Continuing Operations Net Cash From Investing Activities Discontinued Operations Net Cash From Investing Activities 39,720 41,389 42,109 2,311 Net Investing Cash Flow Growth -825 -11,188 -6,000 -134,418 -237,477 -220,038 -40,539 -21,346 |-134,418 -237,477 -220,038 -61,885 -76.67% 7.34% 71.88% 310,496 -2,859 208,203 -8,904 199,299 422.05% Total Current Liabilities Percent change in Total Current Liabilities 112,417 133,513 132,648 128,017 125,668 267,138 295,622 330,332 327,298 288,691 10.66% 11.74% -0.92% -11.80% Long-Term Debt Issuances Long-Term Debt Repayments Debt Issuance Costs 120,000 100,000 -2,380 -46,347 -6,135 -4,506 -578 -761 -1,074 Long-Term Debt and Capital Lease Obligations 230,000 316,447 318,739 319,634 320,528 Equity Repurchases -928 -1,842 -1,394 -1,175 -1,744 Percent change in Long-Term Debt and Capital Lease Obligations 37.59% 0.72% 0.28% 0.28% Equity Issuance Costs -14 Deferred Revenue, Noncurrent Divestment Liabilities, Noncurrent Other Noncurrent Liabilities Total Liabilities Percent change in Total Liabilities 332,934 385,498 381,854 368,782 353,756 8,547 54,135 74,655 75,837 27,376 884,207 1,072,222 1,106,762 1,051,637 21.26% 3.22% -4.98% Noncontrolling Interests Other Financing Activities -83 28,741 991,716 -5.70% Net Cash From Financing Activities - Continuing Operations Net Cash From Financing Activities Net Financing Cash Flow Growth 1,398 1,190 937 111,941 48,495 -1,035 111,941 48,495 -1,035 -56.68% -102.13% 181.26% 2,860 -101 517 841 841 -2,402 -2,402 -385.61% Common Stock Additional Paid In Capital Treasury Stock Accumulated Other Comprehensive Income Retained Earnings (Deficit) Noncontrolling Interest Total Equity Attributable to Parent Total Equity -928 435 -240 -160,379 -132,660 518,610 549,319 11 -134,678 551,681 1,398 679.482 682,219 686,348 690,688 8 695,307 Effect of Currency Exchange Rate Change In Cash and Equivalents Percent change in Total Liabilities Total Liabilities and Equity 580 355 -126,220 -246.773 565,048 448,897 1,447 1,495 518,610 549,319 553,079 566,495 450,392 5.92% 0.68% 2.43% -20.49% ||1,402,817 1,621,541 1,659,841 1,618,132 1,442,108 Cash Paid for Income Taxes Cash Paid for Interest -30 138,618 -94 -479 140 -52,188 -110,775 -25,230 -137.65% -112.26% 77.22% 1,527 1,984 243 345 16,055 21,204 29,846 31,611 -198 278,305 1203.07% -228 29,250 3 5 4 Cost of Revenue Margin 6 Gross Profit Margin MARGINS 83.05% 76.07% 72.94% 74.58% 76.82% Working Capital 273,037 199,718 71,729 Current Ratio 2.022 1.676 1.217 1.218 71,220 354,985 2.230 Days Inventory Outstanding 9.761 % Change in Days Inventory Outstanding 15.157 18.741 17.235 55.28% 23.65% -8.03% 15.000 -12.97% Quick Ratio 1.375 1.055 0.599 0.646 1.548 16.95% 23.93% 27.06% 25.42% 23.18% Debt to Equity Ratio (D/E) 1.705 1.952 2.001 1.856 2.202 Days Sales Outstanding (accounts receivable in days) 4.527 7 Total Operating Expense Margin 15.49% 22.58% 26.66% 26.01% 22.75% Receivables to sales ratio 0.012 0.016 0.020 0.024 0.016 % Change In Days Sales Outstanding (accounts receivable in days) 5.755 7.181 8.616 27.12% 24.78% 19.98% 5.708 -33.75% 8 Operating Income Margin 1.46% 1.35% 0.40% -0.59% 0.43% Inventory turnover ratio 37.4 24.1 19.5 21.2 24.3 9 Total Other Income (Expense) Margin -0.19% -0.59% -0.47% -0.55% -0.50% Average number of days in inventory 9.8 15.2 18.7 0 Pre-tax margin 1.27% 0.76% -0.07% -1.14% -0.07% Fixed asset turnover ratio 9.017 5.157 4.334 17.2 4.359 15.0 7.805 Days Payable Outstanding (accounts payable in days) 6.955 % Change In Days Payable Outstanding (accounts payable in days) 10.332 14.502 14.321 9.220 48.56% 40.36% -1.24% -35.62% 1 Net profit margin 0.78% 0.48% -0.04% 0.37% -0.04% 2 3 4 Return on Assests 5 Return on Equnity 6 Operating Working Capital 4.346% 11.76% 1.709% -0.116% 5.05% -0.35% 1.230% 3.51% -0.192% -0.62% Times interest earned ratio 4.923 0.963 1.132 3.011 1.150 146,144 149,993 153,427 157,157 173,256 Cash to Cash Cycle 7.333 % Change in Cash to Cash Cycle 10.580 11.421 11.529 44.27% 7.94% 0.95% 11.488 -0.36% 7 8
Step by Step Solution
There are 3 Steps involved in it

Get step-by-step solutions from verified subject matter experts