

Question: In tinyML, list at least three reasons why the model should be optimized. What is the trade-off? In tinyML, list at least three reasons why
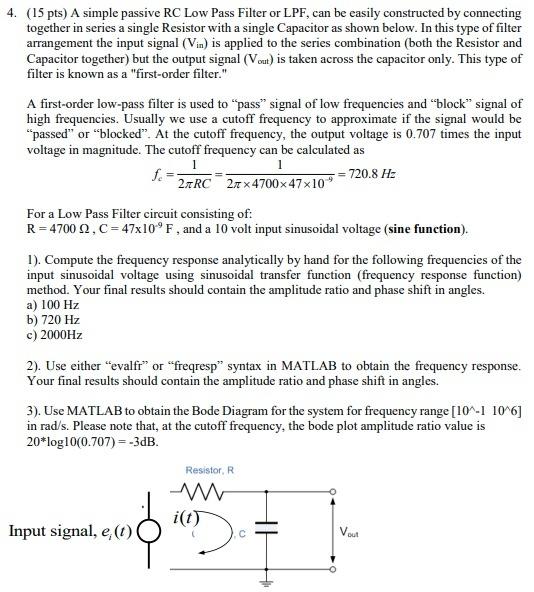
In tinyML, list at least three reasons why the model should be optimized. What is the trade-off? List at least three ways to optimize the tinyML model. (15 pts) A simple passive RC Low Pass Filter or LPF, can be easily constructed by connecting together in series a single Resistor with a single Capacitor as shown below. In this type of filter arrangement the input signal (Vin) is applied to the series combination (both the Resistor and Capacitor together) but the output signal (Vout) is taken across the capacitor only. This type of filter is known as a "first-order filter." A first-order low-pass filter is used to "pass" signal of low frequencies and "block" signal of high frequencies. Usually we use a cutoff frequency to approximate if the signal would be "passed" or "blocked". At the cutoff frequency, the output voltage is 0.707 times the input voltage in magnitude. The cutoff frequency can be calculated as fc=2RC1=24700471091=720.8Hz For a Low Pass Filter circuit consisting of: R=4700,C=47109F, and a 10 volt input sinusoidal voltage (sine function). 1). Compute the frequency response analytically by hand for the following frequencies of the input sinusoidal voltage using sinusoidal transfer function (frequency response function) method. Your final results should contain the amplitude ratio and phase shift in angles. a) 100Hz b) 720Hz c) 2000Hz 2). Use either "evalfr" or "freqresp" syntax in MATLAB to obtain the frequency response. Your final results should contain the amplitude ratio and phase shift in angles. 3). Use MATLAB to obtain the Bode Diagram for the system for frequency range [101106] in rad/s. Please note that, at the cutoff frequency, the bode plot amplitude ratio value is 20log10(0.707)=3dB
Step by Step Solution
There are 3 Steps involved in it

Get step-by-step solutions from verified subject matter experts