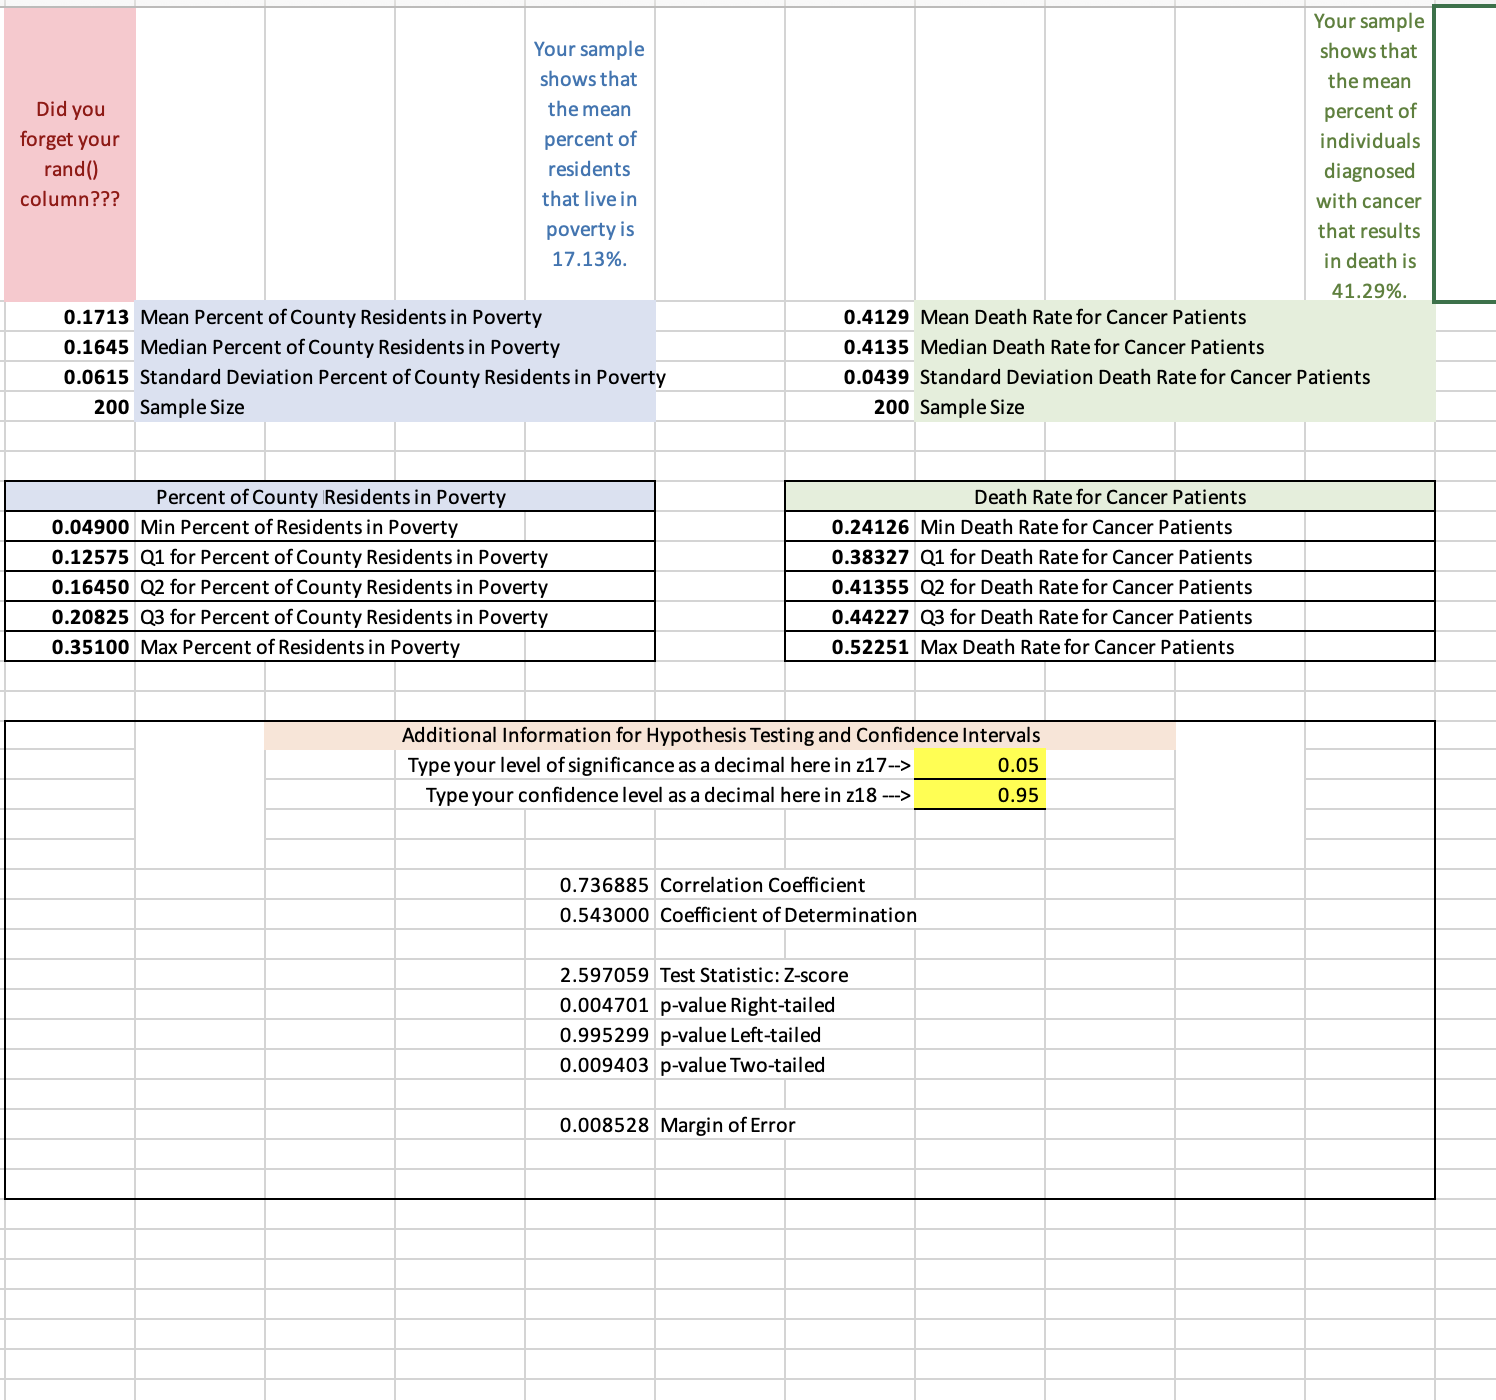
Question: In your Excel file 37.Create a 95% confidence interval for the mean poverty rate. In your report 38.Under the Confidence Interval header, introduce the scenario

In your Excel file 37.Create a 95% confidenceIn your Excel file 37.Create a 95% confidence
In your Excel file 37.Create a 95% confidence interval for the mean poverty rate. In your report 38.Under the \"Confidence Interval\" header, introduce the scenario and the use of confidence intervals for this scenario. a. Specifically address how the confidence interval that you will calculate will help give us further information for this scenario. 39.Under the \"Calculations\" header, state your margin of error and explain what it means. 40.Explain how your confidence interval is calculated. 41.Write your confidence interval using two different proper notations. 42.Under the \"Interval of Interpretation\" header, interpret the confidence interval in the context of this scenario using proper verbiage in sentence format. MTH 315 Project 2 Assignment Instructions 4 43.Under the \"Normal Curve\" header, insert a drawn image of your bell curve with appropriate labeling for your level of confidence, sample mean, and margin of error. Analyze Your Work In your report 44 .Under the \"Conclusions\" header, summarize your findings from your linear regression work. 45.Summarize your findings from your hypothesis test. 46.Summarize your findings from your confidence interval. 47 .Discuss whether your confidence interval supports the conclusions you made in your hypothesis test. Your sample Your sample shows that shows that the mean Did you the mean percent of forget your percent of individuals and() residents diagnosed column??? that live in with cancer poverty is that results 17.13%. in death is 41.29%. 0.1713 Mean Percent of County Residents in Poverty 0.4129 Mean Death Rate for Cancer Patients 0.1645 Median Percent of County Residents in Poverty 0.4135 Median Death Rate for Cancer Patients 0.0615 Standard Deviation Percent of County Residents in Poverty 0.0439 Standard Deviation Death Rate for Cancer Patients 200 Sample Size 200 Sample Size Percent of County Residents in Poverty Death Rate for Cancer Patients 0.04900 Min Percent of Residents in Poverty 0.24126 Min Death Rate for Cancer Patients 0.12575 Q1 for Percent of County Residents in Poverty 0.38327 Q1 for Death Rate for Cancer Patients 0.16450 Q2 for Percent of County Residents in Poverty 0.41355 Q2 for Death Rate for Cancer Patients 25 Q3 for Percent of County Residents in Poverty 7 Q3 for Death Rate for Cancer Patients 100 Max Percent of Re sidents in Poverty .52251 Max Death Rate for Cancer Additional Information for Hypothesis Testing and Confidence Intervals Type your level of significance as a decimal here in z17--> 0.05 Type your confidence level as a decimal here in z18 ---> 0.95 0.736885 Correlation Coefficient 0.543000 Coefficient of Determination 2.597059 Test Statistic: Z-score 0.004701 p-value Right-tailed 0.995299 p-value Left-tailed 0.009403 p-value Two-tailed 0.008528 Margin of Error

Step by Step Solution

There are 3 Steps involved in it

1 Expert Approved Answer
Step: 1 Unlock blur-text-image
Question Has Been Solved by an Expert!

Get step-by-step solutions from verified subject matter experts

Step: 2 Unlock
Step: 3 Unlock

Students Have Also Explored These Related Mathematics Questions!