

Question: In your initial response to the topic you have to answer all questions: 1. Based on the most-recent figures, which of the following categories of
In your initial response to the topic you have to answer all questions:
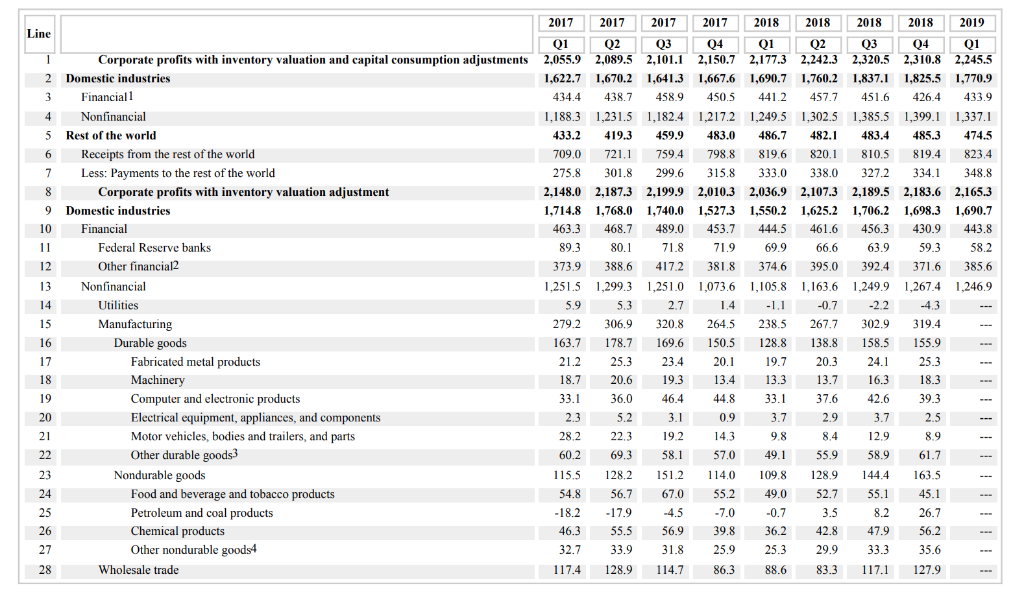
1. Based on the most-recent figures, which of the following categories of industry classifications has the greatest profits:
- Financial or nonfinancial
- Manufacturing , transportation and warehousing, wholesale trade, or retail trade
- Durable goods or nondurable goods
2.During the past years, which sectors had the largest and smallest percentage increase in profit?
3. Which sectors, if any, experienced losses?
4. What are the implications of the profit changes for expansion or contraction of the particular industries?
5. Reflection the students also should include a paragraph in the initial response in their own words reflecting on specifically what they learned from the assignment and how they think they could apply what they learned in the workplace.
2017 2017 2017 2017 2018 2018 2018 2018 2019 Line Q2 03 Q2 03 1 04 Corporate profits with inventory valuation and capital consumption adjustments 2,055.9 2,089.5 2,101.1 2,150.7 2,177.3 2,242.3 2.320,5 2.310.8 2,245.5 1,825.5 ,770.9 2 Domestic industries 1,622.7 1,670.2 1,641.3 1,667.6 1,690.7 1,760.2 1,837.1 Financial 434.4 438.7 450 5 441.2 433 9 458.9 457.7 451.6 426.4 1,302.5 ,385.5 1,399.1 4 Nonfinancial 1,188.3 1,231.5 ,182.4 1,217.2 1,249.5 1.337.1 Rest of the world 5 433.2 419.3 459.9 483.0 486.7 482.1 483.4 485.3 474.5 Receipts from the rest of the world 721,1 759.4 823.4 709.0 798,8 819.6 820.1 810.5 819.4 7 Less: Payments to the rest of the world 275.8 301.8 299.6 315.8 333.0 338.0 327.2 334.1 348.8 2,183.6 2,165.3 8 Corporate profits with inventory valuation adjustment 2,148.0 2,187.3 2,199.9 2,010.3 2,036.9 2,107.3 2,189.5 9 Domestic industries 1,714.8 1,768.0 1,740.0 1,527.3 1,550.2 1,625.2 1,706.2 1,698.3 1,690.7 10 Financial 463.3 468.7 489.0 453.7 444.5 461.6 456.3 430.9 443.8 Federal Reserve banks 11 89.3 80.1 71.8 71.9 69,9 66,6 63.9 59.3 58.2 12 417.2 Other financial2 373.9 388,6 381,8 374.6 395,0 392.4 371,6 385.6 13 Nonfinancial 1,251.5 1,299.3 1.251.0 1.073.6 ,105.8 ,63.6 1,249.9 1,267.4 1.246,9 14 Utilities 5.3 2.7 5.9 14 -1,1 -0.7 -2,2 4.3 15 Manufacturing 279.2 306.9 320.8 264.5 238.5 267.7 302.9 319.4 Durable goods 16 163.7 178.7 169 6 150.5 128.8 138.8 158.5 155.9 17 Fabricated metal products 21.2 25.3 19.7 25.3 23 4 20.1 20.3 24.1 18 Machinery 18.7 20.6 19.3 13 4 13.3 13.7 16.3 18.3 39.3 19 Computer and electronic products Electrical equipment, appliances, and components 33.1 36,0 464 44 8 33.1 37,6 42.6 20 2.3 5.2 3.1 0.9 3.7 2.9 3.7 2,5 Motor vehicles, bodies and trailers, and parts 21 28,2 22.3 19,2 14 3 9.8 8.4 12.9 8.9 Other durable goods3 Nondurable goods 22 60.2 69.3 57.0 49.1 61.7 58.1 55.9 58.9 23 128.2 151.2 128.9 144,4 163.5 115.5 114.0 09.8 24 Food and beverage and tobacco products 54.8 56.7 67.0 55.2 49,0 52.7 55.1 45.1 Petroleum and coal products -18.2 25 -17.9 4.5 7.0 -0.7 3.5 8.2 26.7 26 Chemical products 46.3 55,5 56.9 39.8 36.2 42.8 47.9 56.2 Other nondurable goods4 25.3 27 32.7 33.9 31.8 25 9 29.9 33.3 35.6 28 Wholesale trade 117.4 128.9 114.7 86.3 88.6 83.3 117.1 127.9 2017 2017 2017 2017 2018 2018 2018 2018 2019 Line Q2 03 Q2 03 1 04 Corporate profits with inventory valuation and capital consumption adjustments 2,055.9 2,089.5 2,101.1 2,150.7 2,177.3 2,242.3 2.320,5 2.310.8 2,245.5 1,825.5 ,770.9 2 Domestic industries 1,622.7 1,670.2 1,641.3 1,667.6 1,690.7 1,760.2 1,837.1 Financial 434.4 438.7 450 5 441.2 433 9 458.9 457.7 451.6 426.4 1,302.5 ,385.5 1,399.1 4 Nonfinancial 1,188.3 1,231.5 ,182.4 1,217.2 1,249.5 1.337.1 Rest of the world 5 433.2 419.3 459.9 483.0 486.7 482.1 483.4 485.3 474.5 Receipts from the rest of the world 721,1 759.4 823.4 709.0 798,8 819.6 820.1 810.5 819.4 7 Less: Payments to the rest of the world 275.8 301.8 299.6 315.8 333.0 338.0 327.2 334.1 348.8 2,183.6 2,165.3 8 Corporate profits with inventory valuation adjustment 2,148.0 2,187.3 2,199.9 2,010.3 2,036.9 2,107.3 2,189.5 9 Domestic industries 1,714.8 1,768.0 1,740.0 1,527.3 1,550.2 1,625.2 1,706.2 1,698.3 1,690.7 10 Financial 463.3 468.7 489.0 453.7 444.5 461.6 456.3 430.9 443.8 Federal Reserve banks 11 89.3 80.1 71.8 71.9 69,9 66,6 63.9 59.3 58.2 12 417.2 Other financial2 373.9 388,6 381,8 374.6 395,0 392.4 371,6 385.6 13 Nonfinancial 1,251.5 1,299.3 1.251.0 1.073.6 ,105.8 ,63.6 1,249.9 1,267.4 1.246,9 14 Utilities 5.3 2.7 5.9 14 -1,1 -0.7 -2,2 4.3 15 Manufacturing 279.2 306.9 320.8 264.5 238.5 267.7 302.9 319.4 Durable goods 16 163.7 178.7 169 6 150.5 128.8 138.8 158.5 155.9 17 Fabricated metal products 21.2 25.3 19.7 25.3 23 4 20.1 20.3 24.1 18 Machinery 18.7 20.6 19.3 13 4 13.3 13.7 16.3 18.3 39.3 19 Computer and electronic products Electrical equipment, appliances, and components 33.1 36,0 464 44 8 33.1 37,6 42.6 20 2.3 5.2 3.1 0.9 3.7 2.9 3.7 2,5 Motor vehicles, bodies and trailers, and parts 21 28,2 22.3 19,2 14 3 9.8 8.4 12.9 8.9 Other durable goods3 Nondurable goods 22 60.2 69.3 57.0 49.1 61.7 58.1 55.9 58.9 23 128.2 151.2 128.9 144,4 163.5 115.5 114.0 09.8 24 Food and beverage and tobacco products 54.8 56.7 67.0 55.2 49,0 52.7 55.1 45.1 Petroleum and coal products -18.2 25 -17.9 4.5 7.0 -0.7 3.5 8.2 26.7 26 Chemical products 46.3 55,5 56.9 39.8 36.2 42.8 47.9 56.2 Other nondurable goods4 25.3 27 32.7 33.9 31.8 25 9 29.9 33.3 35.6 28 Wholesale trade 117.4 128.9 114.7 86.3 88.6 83.3 117.1 127.9
Step by Step Solution
There are 3 Steps involved in it

Get step-by-step solutions from verified subject matter experts