

Question: In your narrative analysis that you will write in the Healthcare Budget Request Template, you should address: Income Statement Balances H I J K

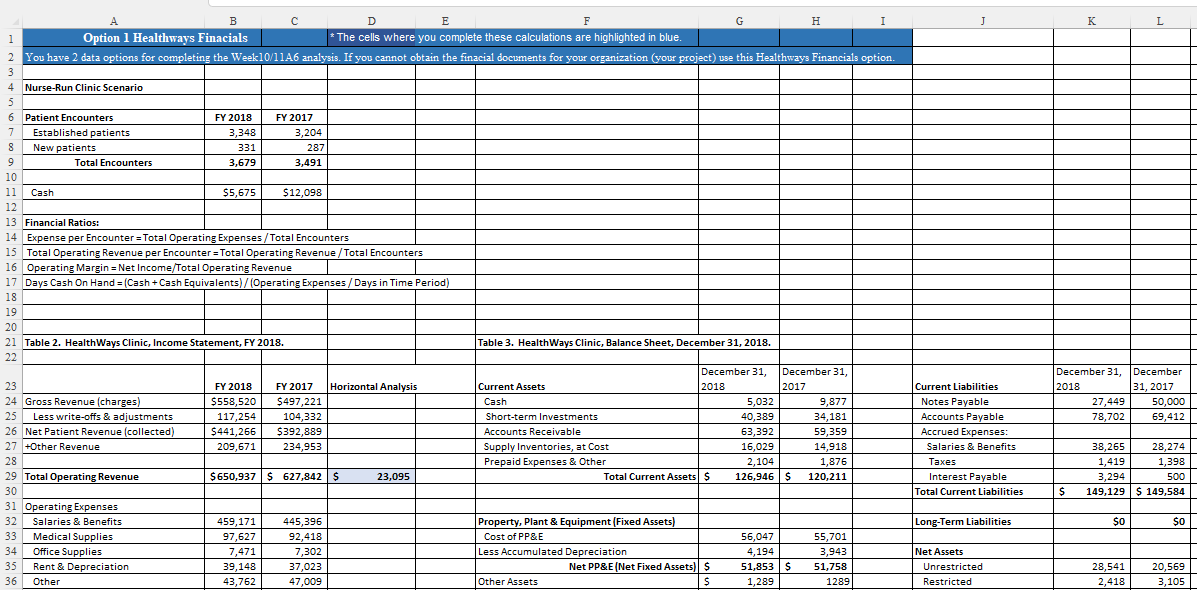
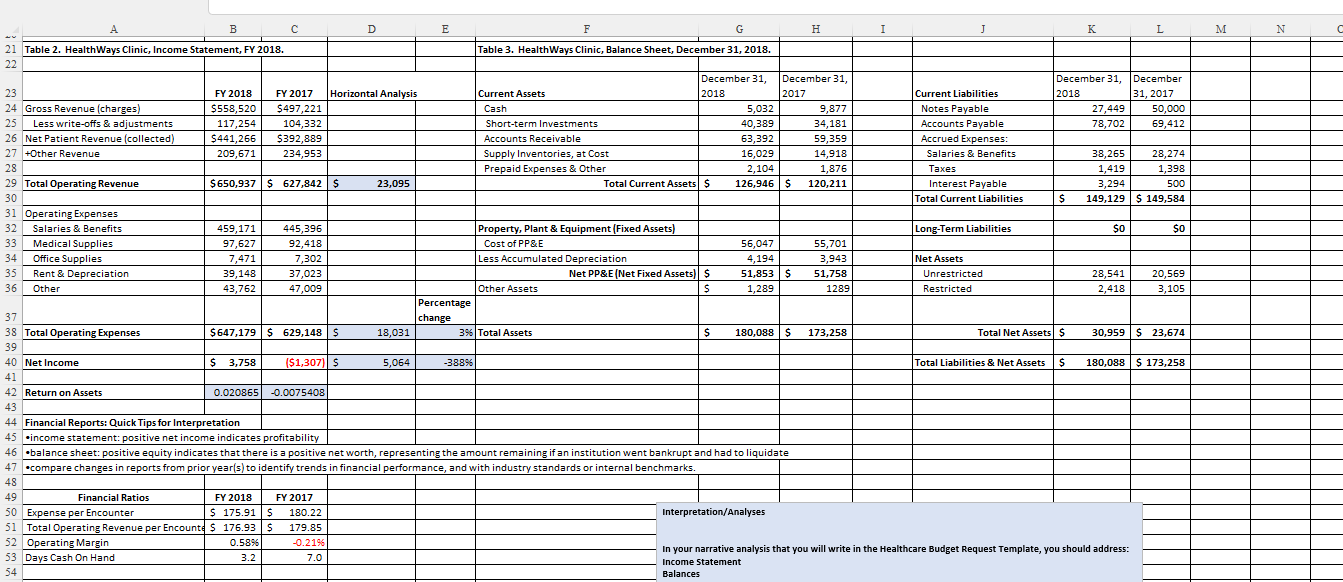
In your narrative analysis that you will write in the Healthcare Budget Request Template, you should address: Income Statement Balances H I J K L A B Option 1 Healthways Finacials D E F *The cells where you complete these calculations are highlighted in blue. G 1 2 You have 2 data options for completing the Week10/11A6 analysis. If you cannot obtain the finacial documents for your organization (your project) use this Healthways Financials option. 3 4 Nurse-Run Clinic Scenario 5 6 Patient Encounters 7 Established patients FY 2018 3,348 FY 2017 3,204 8 New patients 331 9 Total Encounters 3,679 287 3,491 10 11 Cash $5,675 $12,098 12 13 Financial Ratios: 14 Expense per Encounter = Total Operating Expenses/Total Encounters 15 Total Operating Revenue per Encounter = Total Operating Revenue/Total Encounters 16 Operating Margin = Net Income/Total Operating Revenue 17 Days Cash On Hand = (Cash + Cash Equivalents)/(Operating Expenses/Days in Time Period) 18 19 20 21 Table 2. HealthWays Clinic, Income Statement, FY 2018. 22 Table 3. HealthWays Clinic, Balance Sheet, December 31, 2018. 23 24 Gross Revenue (charges) 30 27 +Other Revenue 28 29 Total Operating Revenue 31 Operating Expenses FY 2018 FY 2017 Horizontal Analysis $558,520 25 Less write-offs & adjustments 117,254 $497,221 104,332 Current Assets Cash 26 Net Patient Revenue (collected) $441,266 $392,889 209,671 234,953 $650,937 $627,842 $ 23,095 December 31, 2018 December 31, 2017 5,032 9,877 Short-term Investments Accounts Receivable Supply Inventories, at Cost Prepaid Expenses & Other 40,389 34,181 Current Liabilities Notes Payable Accounts Payable December 31, December 2018 31, 2017 27,449 50,000 78,702 69,412 63,392 59,359 Accrued Expenses: 16,029 14,918 Salaries & Benefits 38,265 28,274 2,104 1,876 Taxes 1,419 1,398 Total Current Assets $ 126,946 $ 120,211 Interest Payable Total Current Liabilities 3,294 500 $ 149,129 $149,584 32 Salaries & Benefits 459,171 445,396 Property, Plant & Equipment (Fixed Assets) Long-Term Liabilities $0 $0 33 Medical Supplies 97,627 92,418 Cost of PP&E 56,047 34 Office Supplies 7,471 7,302 Less Accumulated Depreciation 4,194 35 Rent & Depreciation 39,148 37,023 Net PP&E (Net Fixed Assets) $ 51,853 $ 55,701 3,943 51,758 Net Assets 36 Other 43,762 47,009 Other Assets $ 1,289 1289 Unrestricted Restricted 28,541 2,418 20,569 3,105 A B D E F H I K L M N 21 Table 2. HealthWays Clinic, Income Statement, FY 2018. 22 Table 3. HealthWays Clinic, Balance Sheet, December 31, 2018. 23 FY 2018 24 Gross Revenue (charges) $558,520 FY 2017 Horizontal Analysis $497,221 Current Assets Cash December 31, 2018 December 31, 2017 December 31, December 5,032 9,877 25 Less write-offs & adjustments 117,254 104,332 26 Net Patient Revenue (collected) $441,266 $392,889 Short-term Investments Accounts Receivable 40,389 34,181 Current Liabilities Notes Payable Accounts Payable 2018 31, 2017 27,449 50,000 78,702 69,412 63,392 59,359 Accrued Expenses: 27 +Other Revenue 209,671 234,953 30 28 29 Total Operating Revenue 31 Operating Expenses Supply Inventories, at Cost Prepaid Expenses & Other 16,029 14,918 2,104 1,876 Salaries & Benefits Taxes 38,265 28,274 1,419 $650,937 $ 627,842 $ 23,095 Total Current Assets $ 126,946 $ 120,211 Interest Payable Total Current Liabilities $ 3,294 149,129 $ 149,584 1,398 500 Long-Term Liabilities $0 $0 32 Salaries & Benefits 459,171 445,396 33 Medical Supplies 97,627 92,418 34 Office Supplies 7,471 7,302 35 Rent & Depreciation 39,148 37,023 36 Other 43,762 47,009 37 Property, Plant & Equipment (Fixed Assets) Cost of PP&E 56,047 Less Accumulated Depreciation 4,194 55,701 3,943 Net PP&E (Net Fixed Assets) $ 51,853 $ Other Assets S 1,289 51,758 1289 Net Assets Unrestricted Restricted 28,541 2,418 20,569 3,105 Percentage change $647,179 $ 629,148 $ 18,031 $ 3,758 ($1,307) $ 5,064 0.020865 -0.0075408 38 Total Operating Expenses 39 40 Net Income 41 42 Return on Assets 43 44 Financial Reports: Quick Tips for Interpretation 45 income statement: positive net income indicates profitability 46 balance sheet: positive equity indicates that there is a positive net worth, representing the amount remaining if an institution went bankrupt and had to liquidate 47 compare changes in reports from prior year(s) to identify trends in financial performance, and with industry standards or internal benchmarks. 3% Total Assets -388% $ 180,088 $ 173,258 Total Net Assets $ 30,959 $23,674 Total Liabilities & Net Assets $ 180,088 $ 173,258 48 49 Financial Ratios FY 2018 FY 2017 50 Expense per Encounter $ 175.91 $ 180.22 51 Total Operating Revenue per Encounte$ 176.93 $ 179.85 52 Operating Margin 0.58% -0.21% 53 Days Cash On Hand 3.2 7.0 54 Interpretation/Analyses In your narrative analysis that you will write in the Healthcare Budget Request Template, you should address: Income Statement Balances
Step by Step Solution
There are 3 Steps involved in it

Get step-by-step solutions from verified subject matter experts