

Question: In your view, based on the statements and ratio analysis, briefly describe strengths and weaknesses in financial position of this client. $ 3,000 5,000 LIABILITIES
In your view, based on the statements and ratio analysis, briefly describe strengths and weaknesses in financial position of this client. 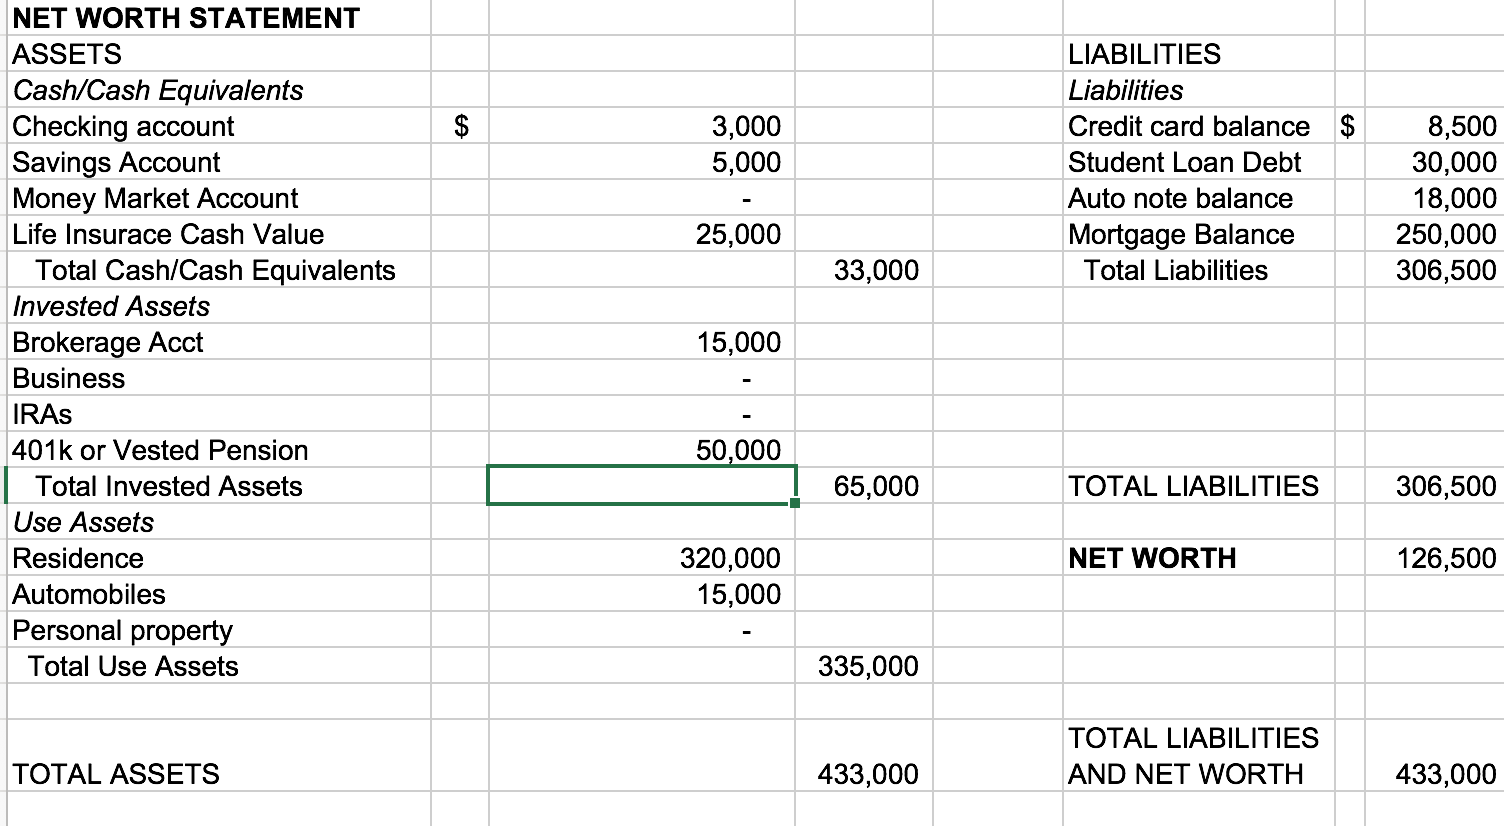
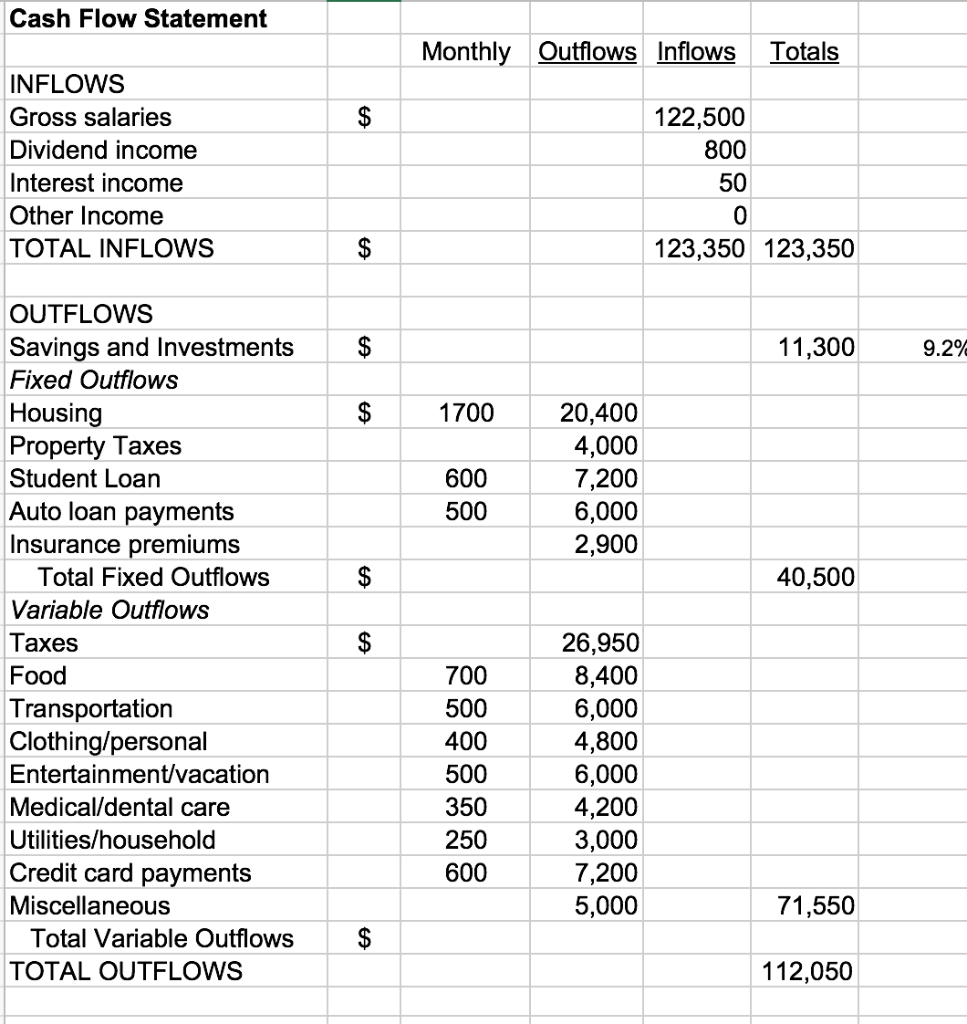
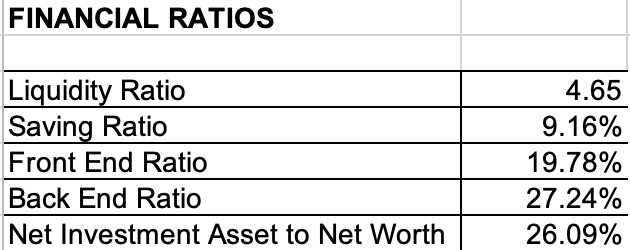
$ 3,000 5,000 LIABILITIES Liabilities Credit card balance $ Student Loan Debt Auto note balance Mortgage Balance Total Liabilities 8,500 30,000 18,000 250,000 306,500 25,000 33,000 NET WORTH STATEMENT ASSETS Cash/Cash Equivalents Checking account Savings Account Money Market Account Life Insurace Cash Value Total Cash/Cash Equivalents Invested Assets Brokerage Acct Business IRAs 401k or Vested Pension Total Invested Assets Use Assets Residence Automobiles Personal property Total Use Assets 15,000 50,000 65,000 TOTAL LIABILITIES 306,500 NET WORTH 126,500 320,000 15,000 335,000 TOTAL LIABILITIES AND NET WORTH TOTAL ASSETS 433,000 433,000 Cash Flow Statement Monthly Outflows Inflows Totals $ INFLOWS Gross salaries Dividend income Interest income Other Income TOTAL INFLOWS 122,500 800 50 0 123,350 123,350 $ $ 11,300 9.2% 1700 600 500 20,400 4,000 7,200 6,000 2,900 $ 40,500 OUTFLOWS Savings and Investments Fixed Outflows Housing Property Taxes Student Loan Auto loan payments Insurance premiums Total Fixed Outflows Variable Outflows Taxes Food Transportation Clothing/personal Entertainment/vacation Medical/dental care Utilities/household Credit card payments Miscellaneous Total Variable Outflows TOTAL OUTFLOWS $ 700 500 400 500 350 250 600 26,950 8,400 6,000 4,800 6,000 4,200 3,000 7,200 5,000 71,550 $ 112,050 FINANCIAL RATIOS Liquidity Ratio Saving Ratio Front End Ratio Back End Ratio Net Investment Asset to Net Worth 4.65 9.16% 19.78% 27.24% 26.09% $ 3,000 5,000 LIABILITIES Liabilities Credit card balance $ Student Loan Debt Auto note balance Mortgage Balance Total Liabilities 8,500 30,000 18,000 250,000 306,500 25,000 33,000 NET WORTH STATEMENT ASSETS Cash/Cash Equivalents Checking account Savings Account Money Market Account Life Insurace Cash Value Total Cash/Cash Equivalents Invested Assets Brokerage Acct Business IRAs 401k or Vested Pension Total Invested Assets Use Assets Residence Automobiles Personal property Total Use Assets 15,000 50,000 65,000 TOTAL LIABILITIES 306,500 NET WORTH 126,500 320,000 15,000 335,000 TOTAL LIABILITIES AND NET WORTH TOTAL ASSETS 433,000 433,000 Cash Flow Statement Monthly Outflows Inflows Totals $ INFLOWS Gross salaries Dividend income Interest income Other Income TOTAL INFLOWS 122,500 800 50 0 123,350 123,350 $ $ 11,300 9.2% 1700 600 500 20,400 4,000 7,200 6,000 2,900 $ 40,500 OUTFLOWS Savings and Investments Fixed Outflows Housing Property Taxes Student Loan Auto loan payments Insurance premiums Total Fixed Outflows Variable Outflows Taxes Food Transportation Clothing/personal Entertainment/vacation Medical/dental care Utilities/household Credit card payments Miscellaneous Total Variable Outflows TOTAL OUTFLOWS $ 700 500 400 500 350 250 600 26,950 8,400 6,000 4,800 6,000 4,200 3,000 7,200 5,000 71,550 $ 112,050 FINANCIAL RATIOS Liquidity Ratio Saving Ratio Front End Ratio Back End Ratio Net Investment Asset to Net Worth 4.65 9.16% 19.78% 27.24% 26.09%
Step by Step Solution
There are 3 Steps involved in it

Get step-by-step solutions from verified subject matter experts