

Question: In-Class Exercise Altitude Temperature | Pressure H, ft T, F P, 20/14= -5000 74.84 1755 57.00 14.70 Troposphere Enter the data from this table.
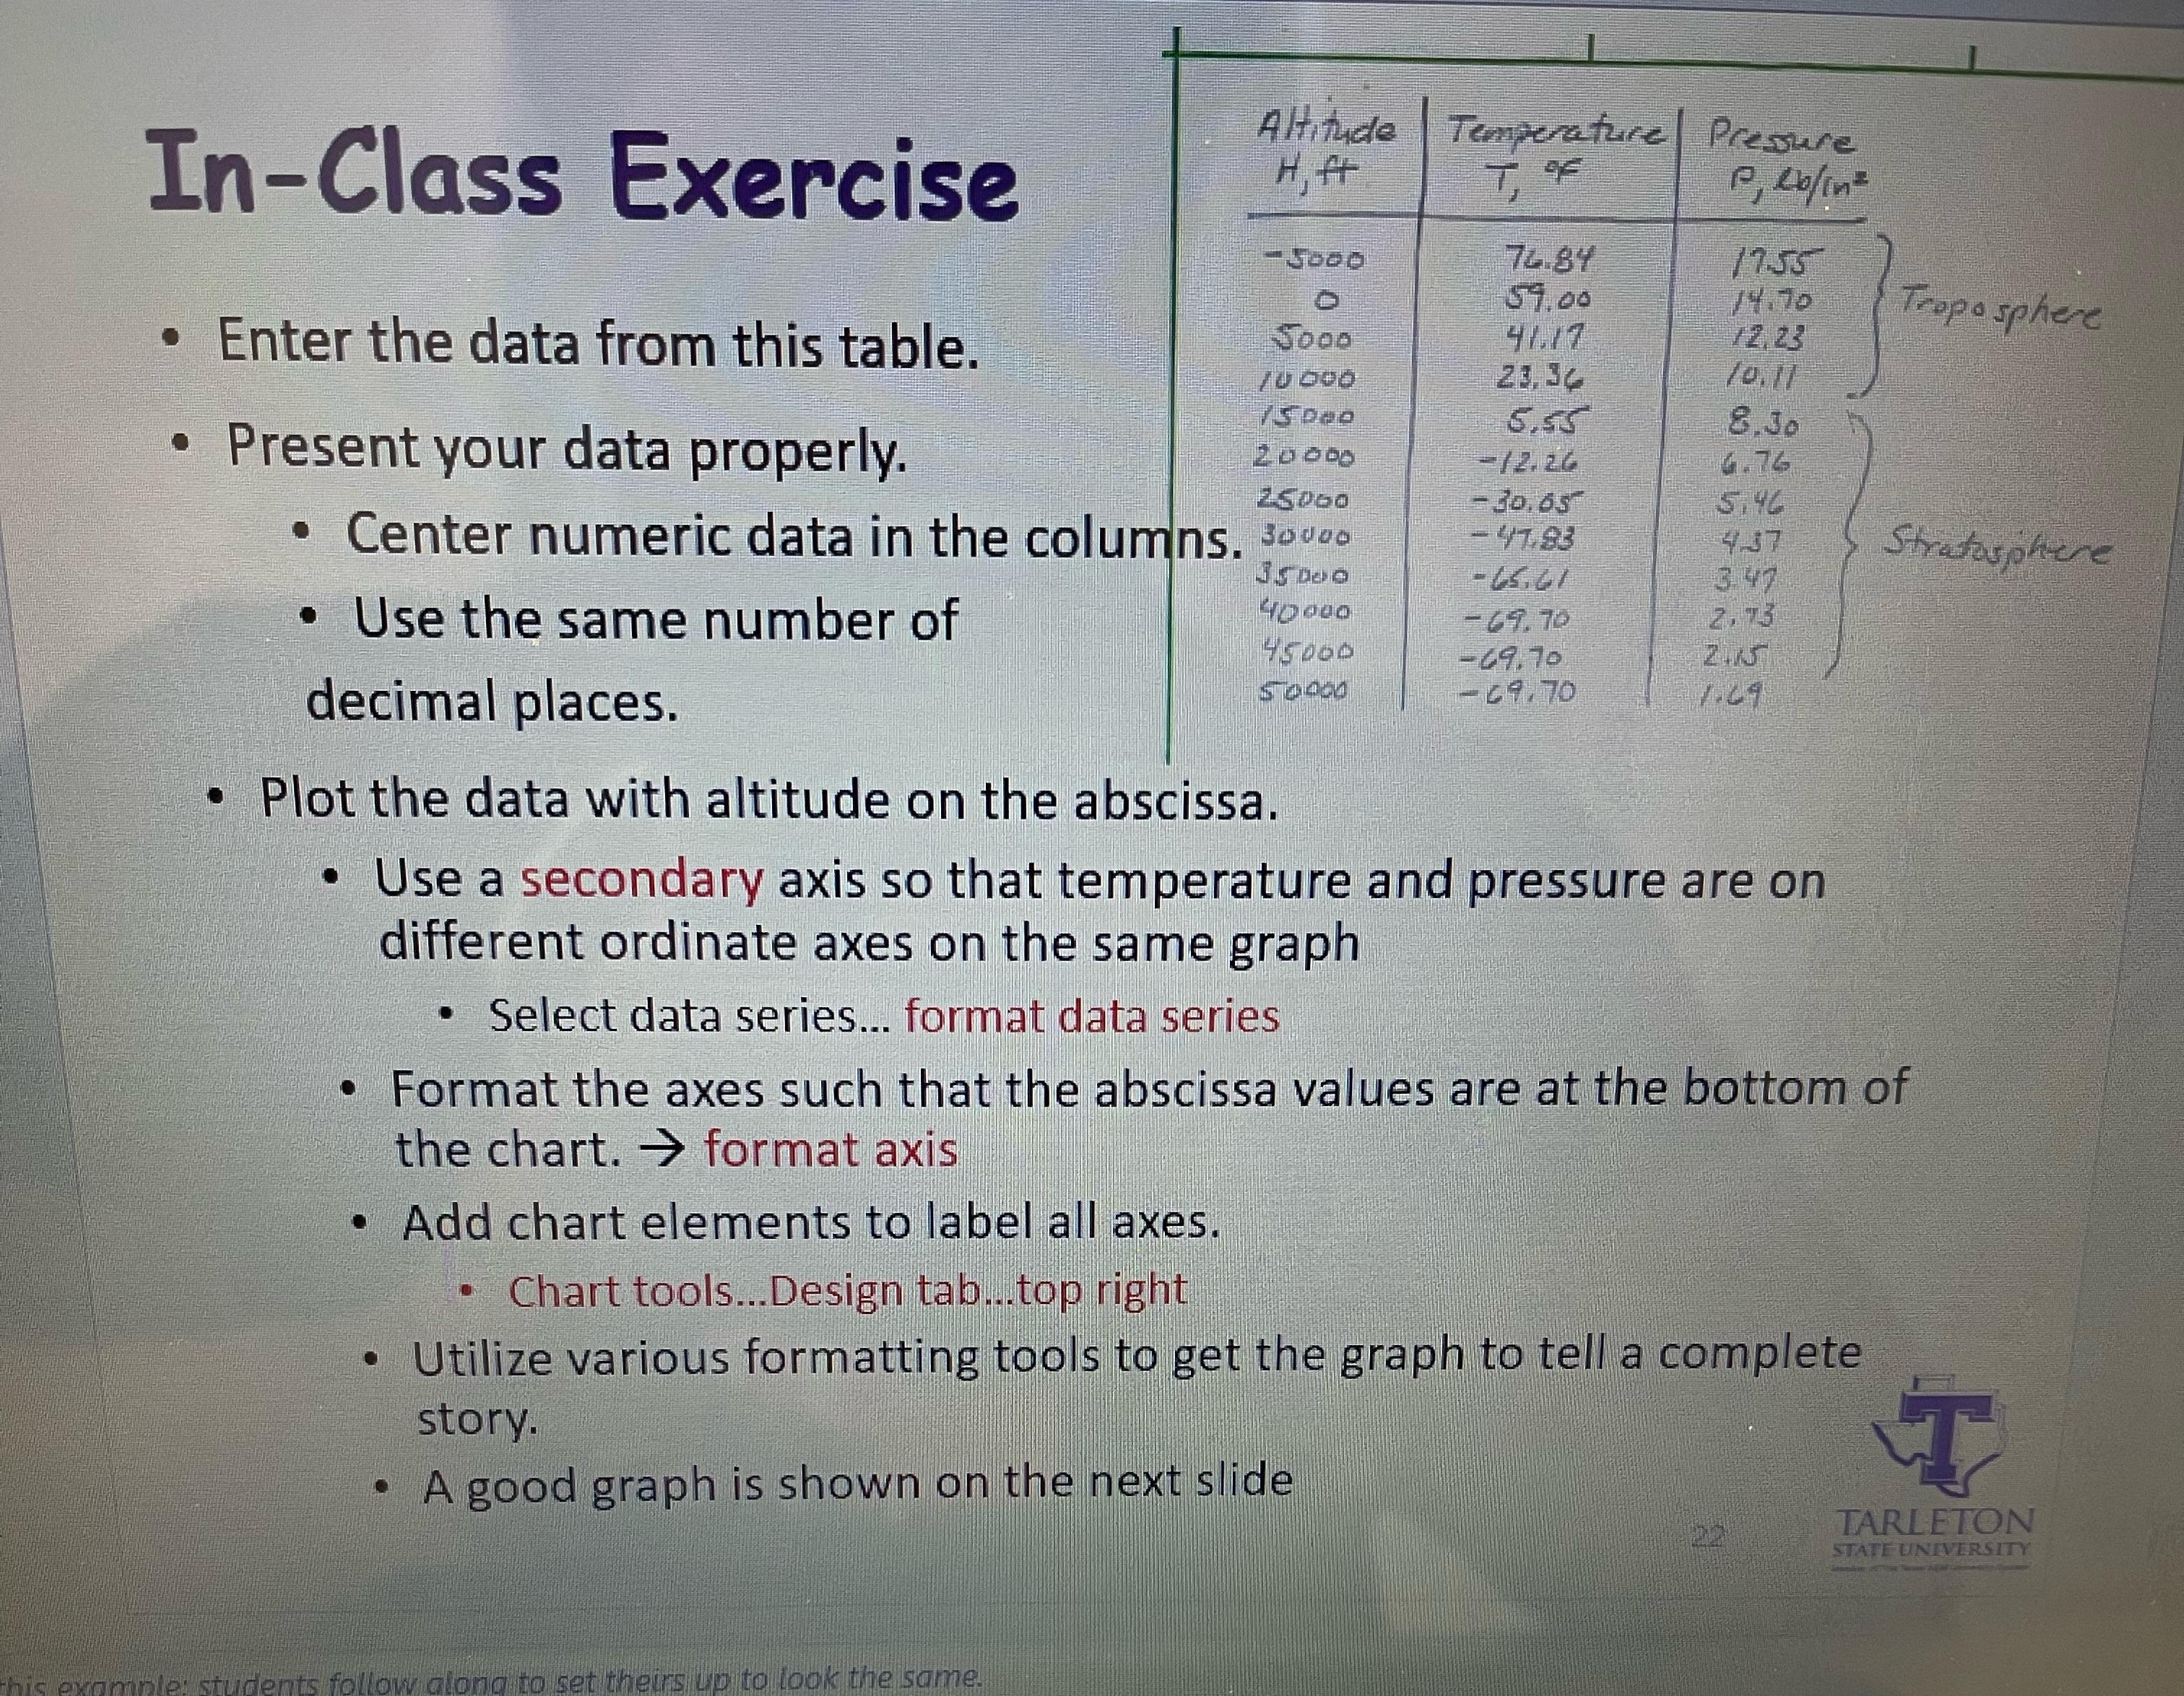
In-Class Exercise Altitude Temperature | Pressure H, ft T, F P, 20/14= -5000 74.84 1755 57.00 14.70 Troposphere Enter the data from this table. 5000 4617 12.23 10000 23.30 10.11 15000 6.55 8.30 Present your data properly. 20000 -12.26 4.76 25000 -30.65 5.46 Center numeric data in the columns. 30000 -47.83 4.37 Jo Stratosphere -65.61 3.47 Use the same number of 40000 -69.70 2.73 45000 -69.70 2115 decimal places. 50000 -69.70 1.09 Plot the data with altitude on the abscissa. Use a secondary axis so that temperature and pressure are on different ordinate axes on the same graph Select data series... format data series Format the axes such that the abscissa values are at the bottom of the chart. format axis Add chart elements to label all axes. Chart tools... Design tab...top right Utilize various formatting tools to get the graph to tell a complete story. A good graph is shown on the next slide this example: students follow along to set theirs up to look the same. TARLETON STATE UNIVERSITY
Step by Step Solution
There are 3 Steps involved in it

Get step-by-step solutions from verified subject matter experts