Question: In-class exercise: Introduction to Maps The file needed for this exercise is restaurants.xlsx Your client is a food critic who has been visiting fine restaurants

In-class exercise: Introduction to Maps

The file needed for this exercise is restaurants.xlsx

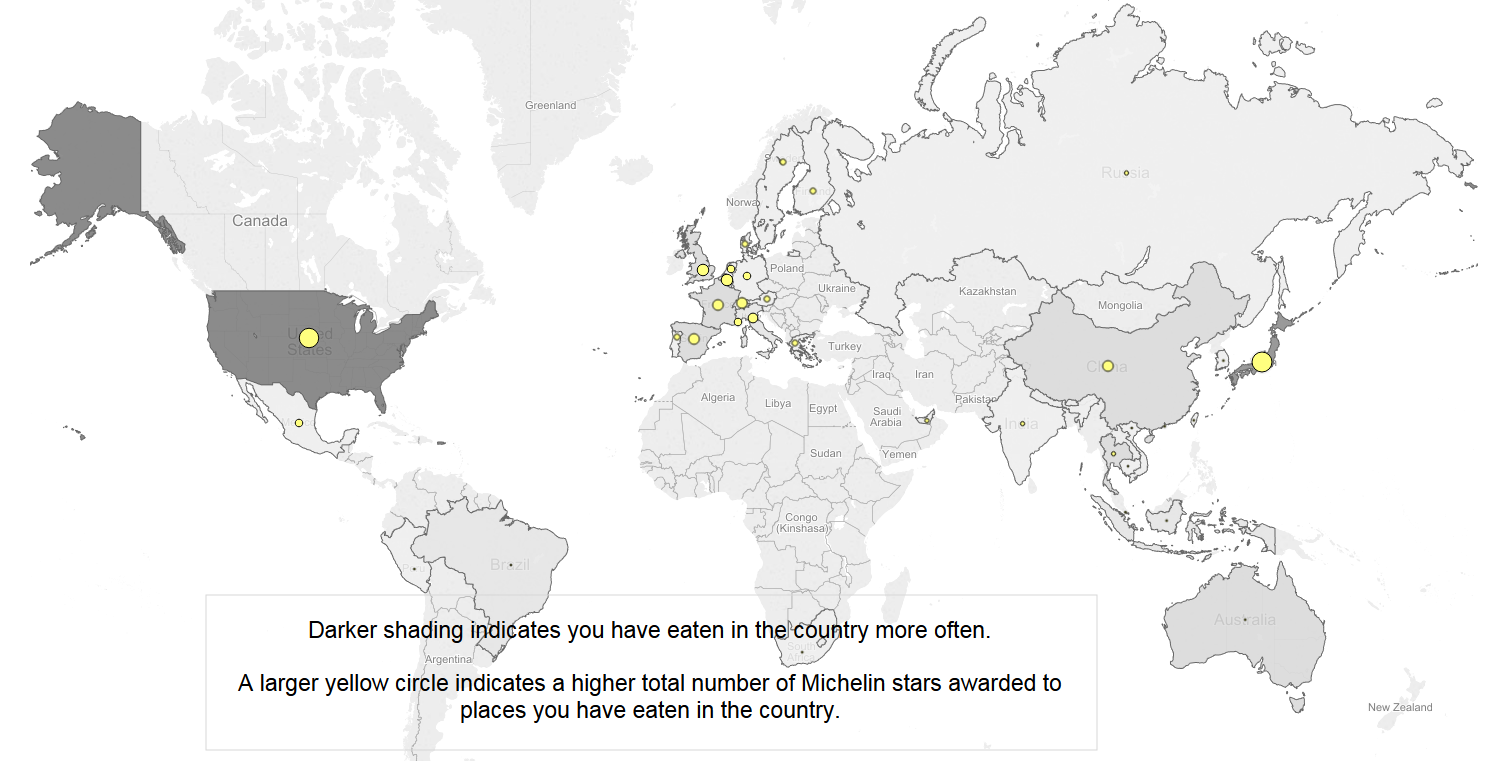
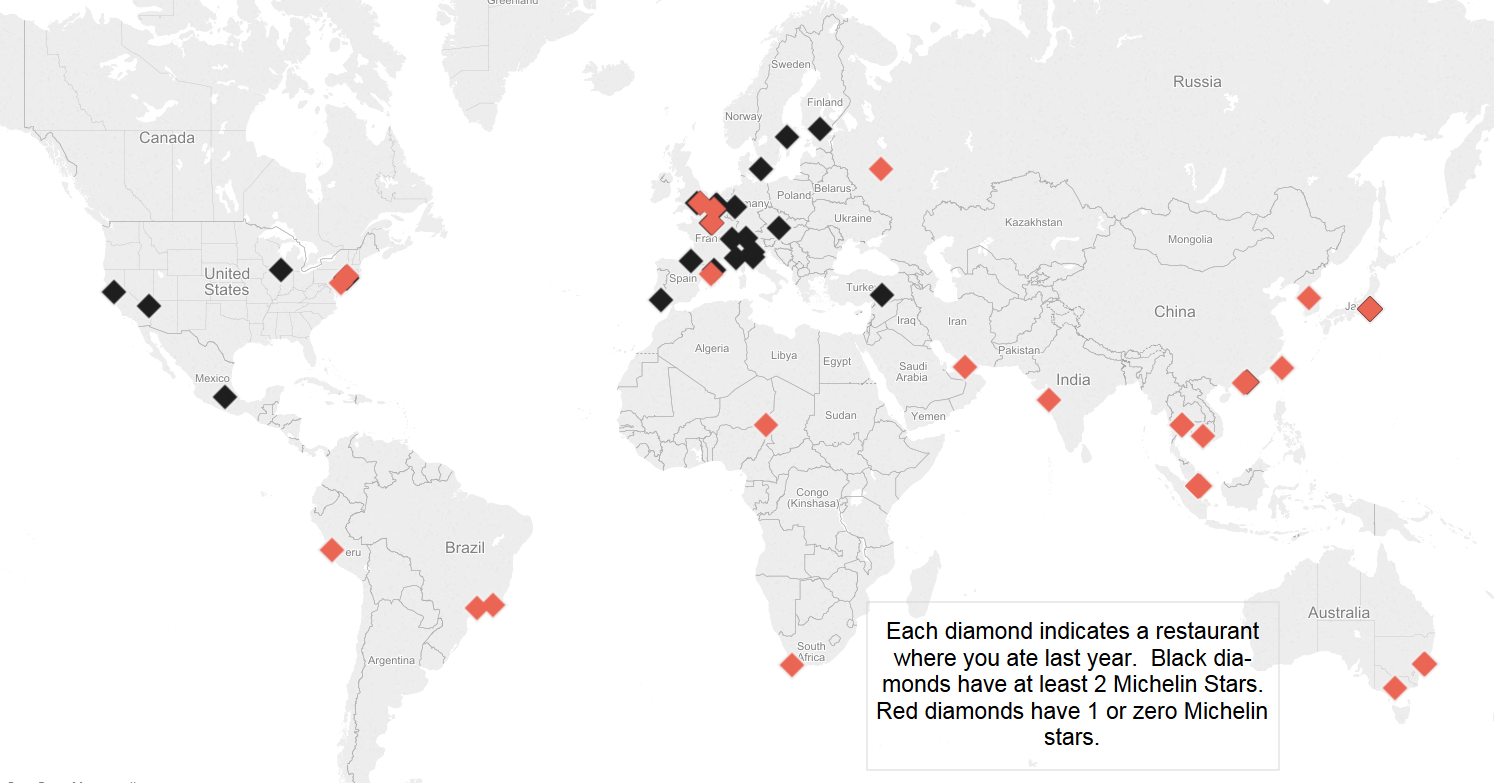
Your client is a food critic who has been visiting fine restaurants all over the world. She has provided you with an Excel file that includes the exact location of each restaurant (latitude/longitude) that she visited last year, along with other useful information such as the type of cuisine, Michelin star information, etc. Use Tableau to create the following visualizations of this dataset (without the Annotations):

Visualization 1:

In-class exercise: Introduction to Maps The fileIn-class exercise: Introduction to Maps The file
Greenland Rusia Norwa . Canada Poland Ukraine Kazakhstan Mongolia Turkey CIO a Iraq Iran Algeria Pakistan Libya Egypt Saudi Arabia O Sudan Yemen Congo (Kinshasa) Brazil Australia Darker shading indicates you have eaten in the country more often. Argentina A larger yellow circle indicates a higher total number of Michelin stars awarded to New Zealand places you have eaten in the country.Sweden Russia Finland Norway Canada Poland Belarus any Ukraine Kazakhstan Mongolia United ~7spain States Turk China Iraq Iran Algeria Libya Pakistan Egypt Saudi Mexico Arabia India Sudan Yemen Congo (Kinshasa) ery Brazil Australia South Each diamond indicates a restaurant Africa Argentina where you ate last year. Black dia- monds have at least 2 Michelin Stars. Red diamonds have 1 or zero Michelin stars

Step by Step Solution

There are 3 Steps involved in it

1 Expert Approved Answer
Step: 1 Unlock blur-text-image
Question Has Been Solved by an Expert!

Get step-by-step solutions from verified subject matter experts

Step: 2 Unlock
Step: 3 Unlock

Students Have Also Explored These Related Finance Questions!