

Question: In-Class Problem GE a 1.For the distribution of data shown in the graphs to the right, would you use linear or polynomial regression? . 50
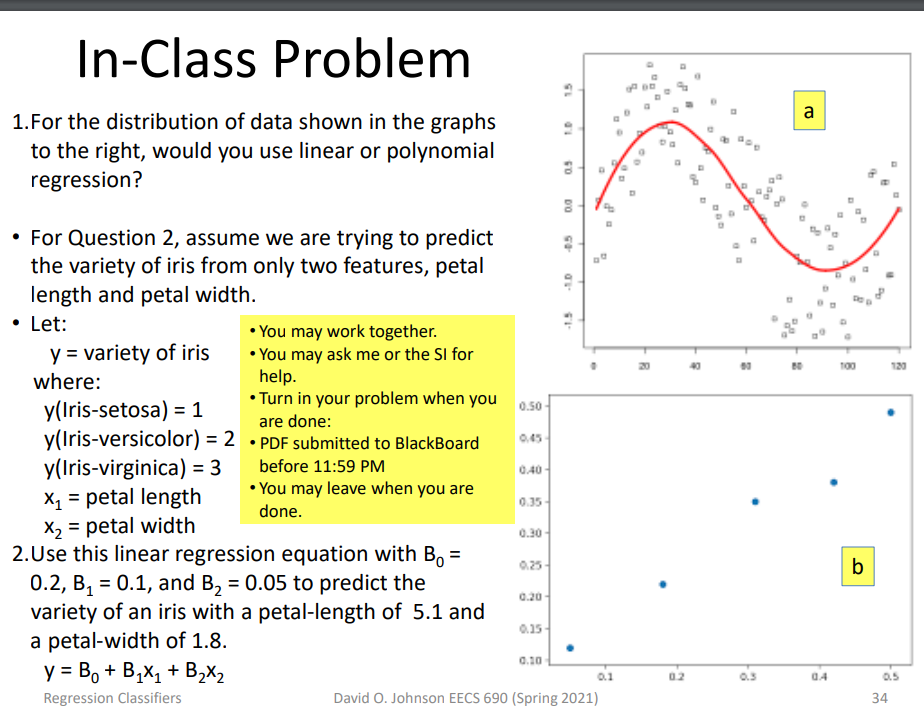
In-Class Problem GE a 1.For the distribution of data shown in the graphs to the right, would you use linear or polynomial regression? . 50 8 D . 000 f 3 GO . -1.5 20 100 120 help. For Question 2, assume we are trying to predict the variety of iris from only two features, petal length and petal width. Let: . You may work together. y = variety of iris . You may ask me or the Sl for where: y(Iris-setosa) = 1 Turn in your problem when you 0.50 are done: y(Iris-versicolor) = 2 PDF submitted to BlackBoard y(Iris-virginica) = 3 before 11:59 PM X1 = petal length . You may leave when you are done. X2 = petal width 0.30- 2.Use this linear regression equation with B. = 025- 0.2, B, = 0.1, and B2 = 0.05 to predict the 0.20 variety of an iris with a petal-length of 5.1 and 0.15 a petal-width of 1.8. y = B. + B,X1 + B2X2 Regression Classifiers David O. Johnson EECS 690 (Spring 2021) 0.40 b 0.30 0.1 02 04 0.5 34
Step by Step Solution
There are 3 Steps involved in it

Get step-by-step solutions from verified subject matter experts