

Question: Include a detailed analysis below each individual chart, including the following The reasons behind the changes in each ratio, Whether the changes have been good
Include a detailed analysis below each individual chart, including the following
The reasons behind the changes in each ratio,
Whether the changes have been good or bad,
In the analysis, seek to answer such questions as the following:
Has the company been well managed financially?
Are there specific areas that the company needs to address?
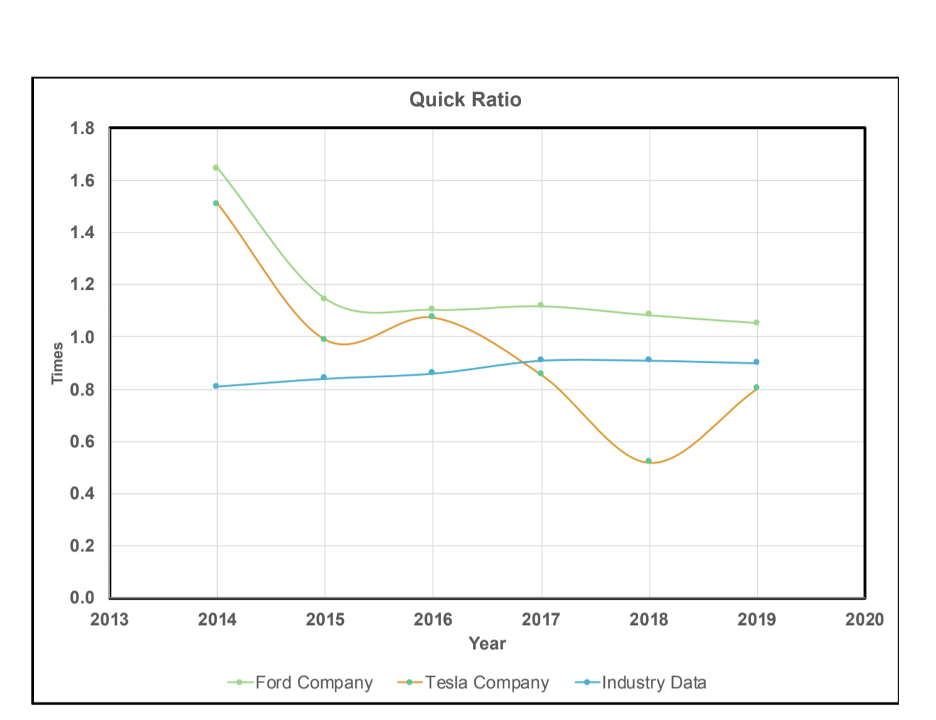
Quick Ratio 1.8 1.6 1.4 1.2 1.0 Times 0.8 0.6 0.4 0.2 0.0 2013 2014 2015 2016 2017 2018 2019 2020 Year Ford Company --Tesla Company Industry Data
Step by Step Solution
There are 3 Steps involved in it
1 Expert Approved Answer
Step: 1 Unlock

Question Has Been Solved by an Expert!
Get step-by-step solutions from verified subject matter experts
Step: 2 Unlock
Step: 3 Unlock