Question: Include a final conclusion that concludes whether or not our investor should proceed with an investment in the Hershey Company based off the financials provided.
Include a final conclusion that concludes whether or not our investor should proceed with an investment in the Hershey Company based off the financials provided. Your conclusion should be supported by the various bits of information presented. If you do not recommend the purchase of Hershey company, indicate why you came to this conclusion
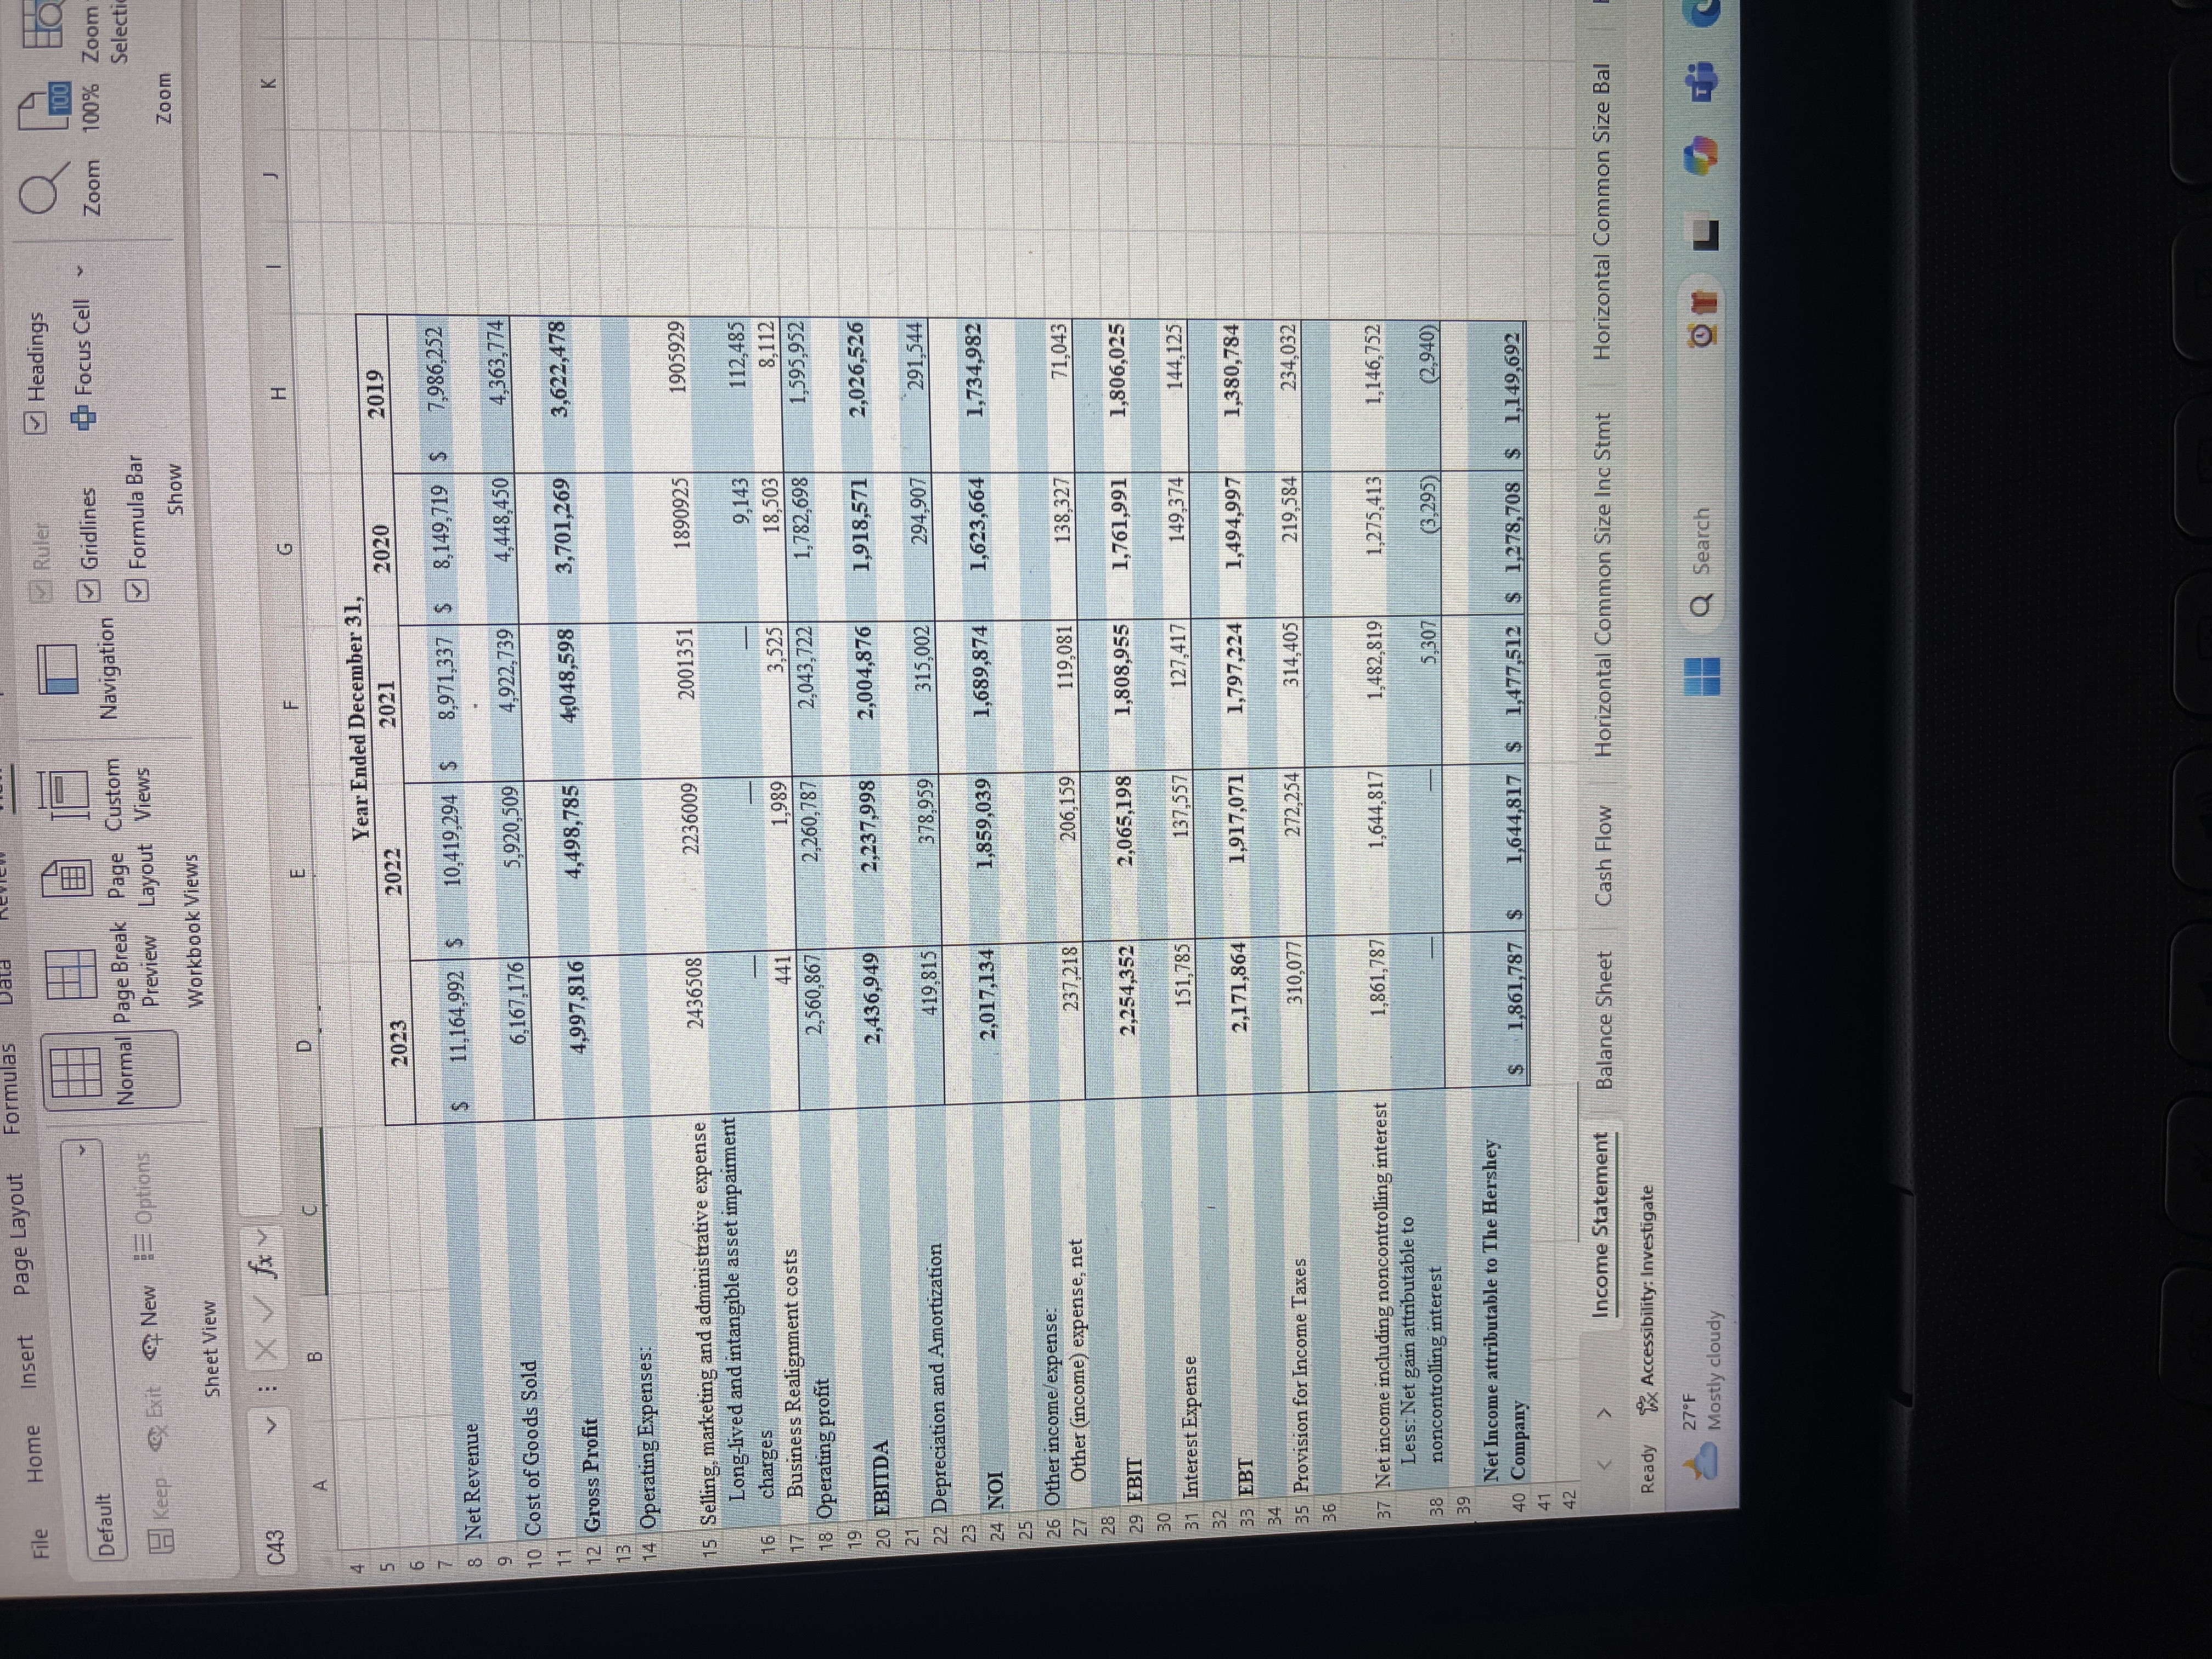
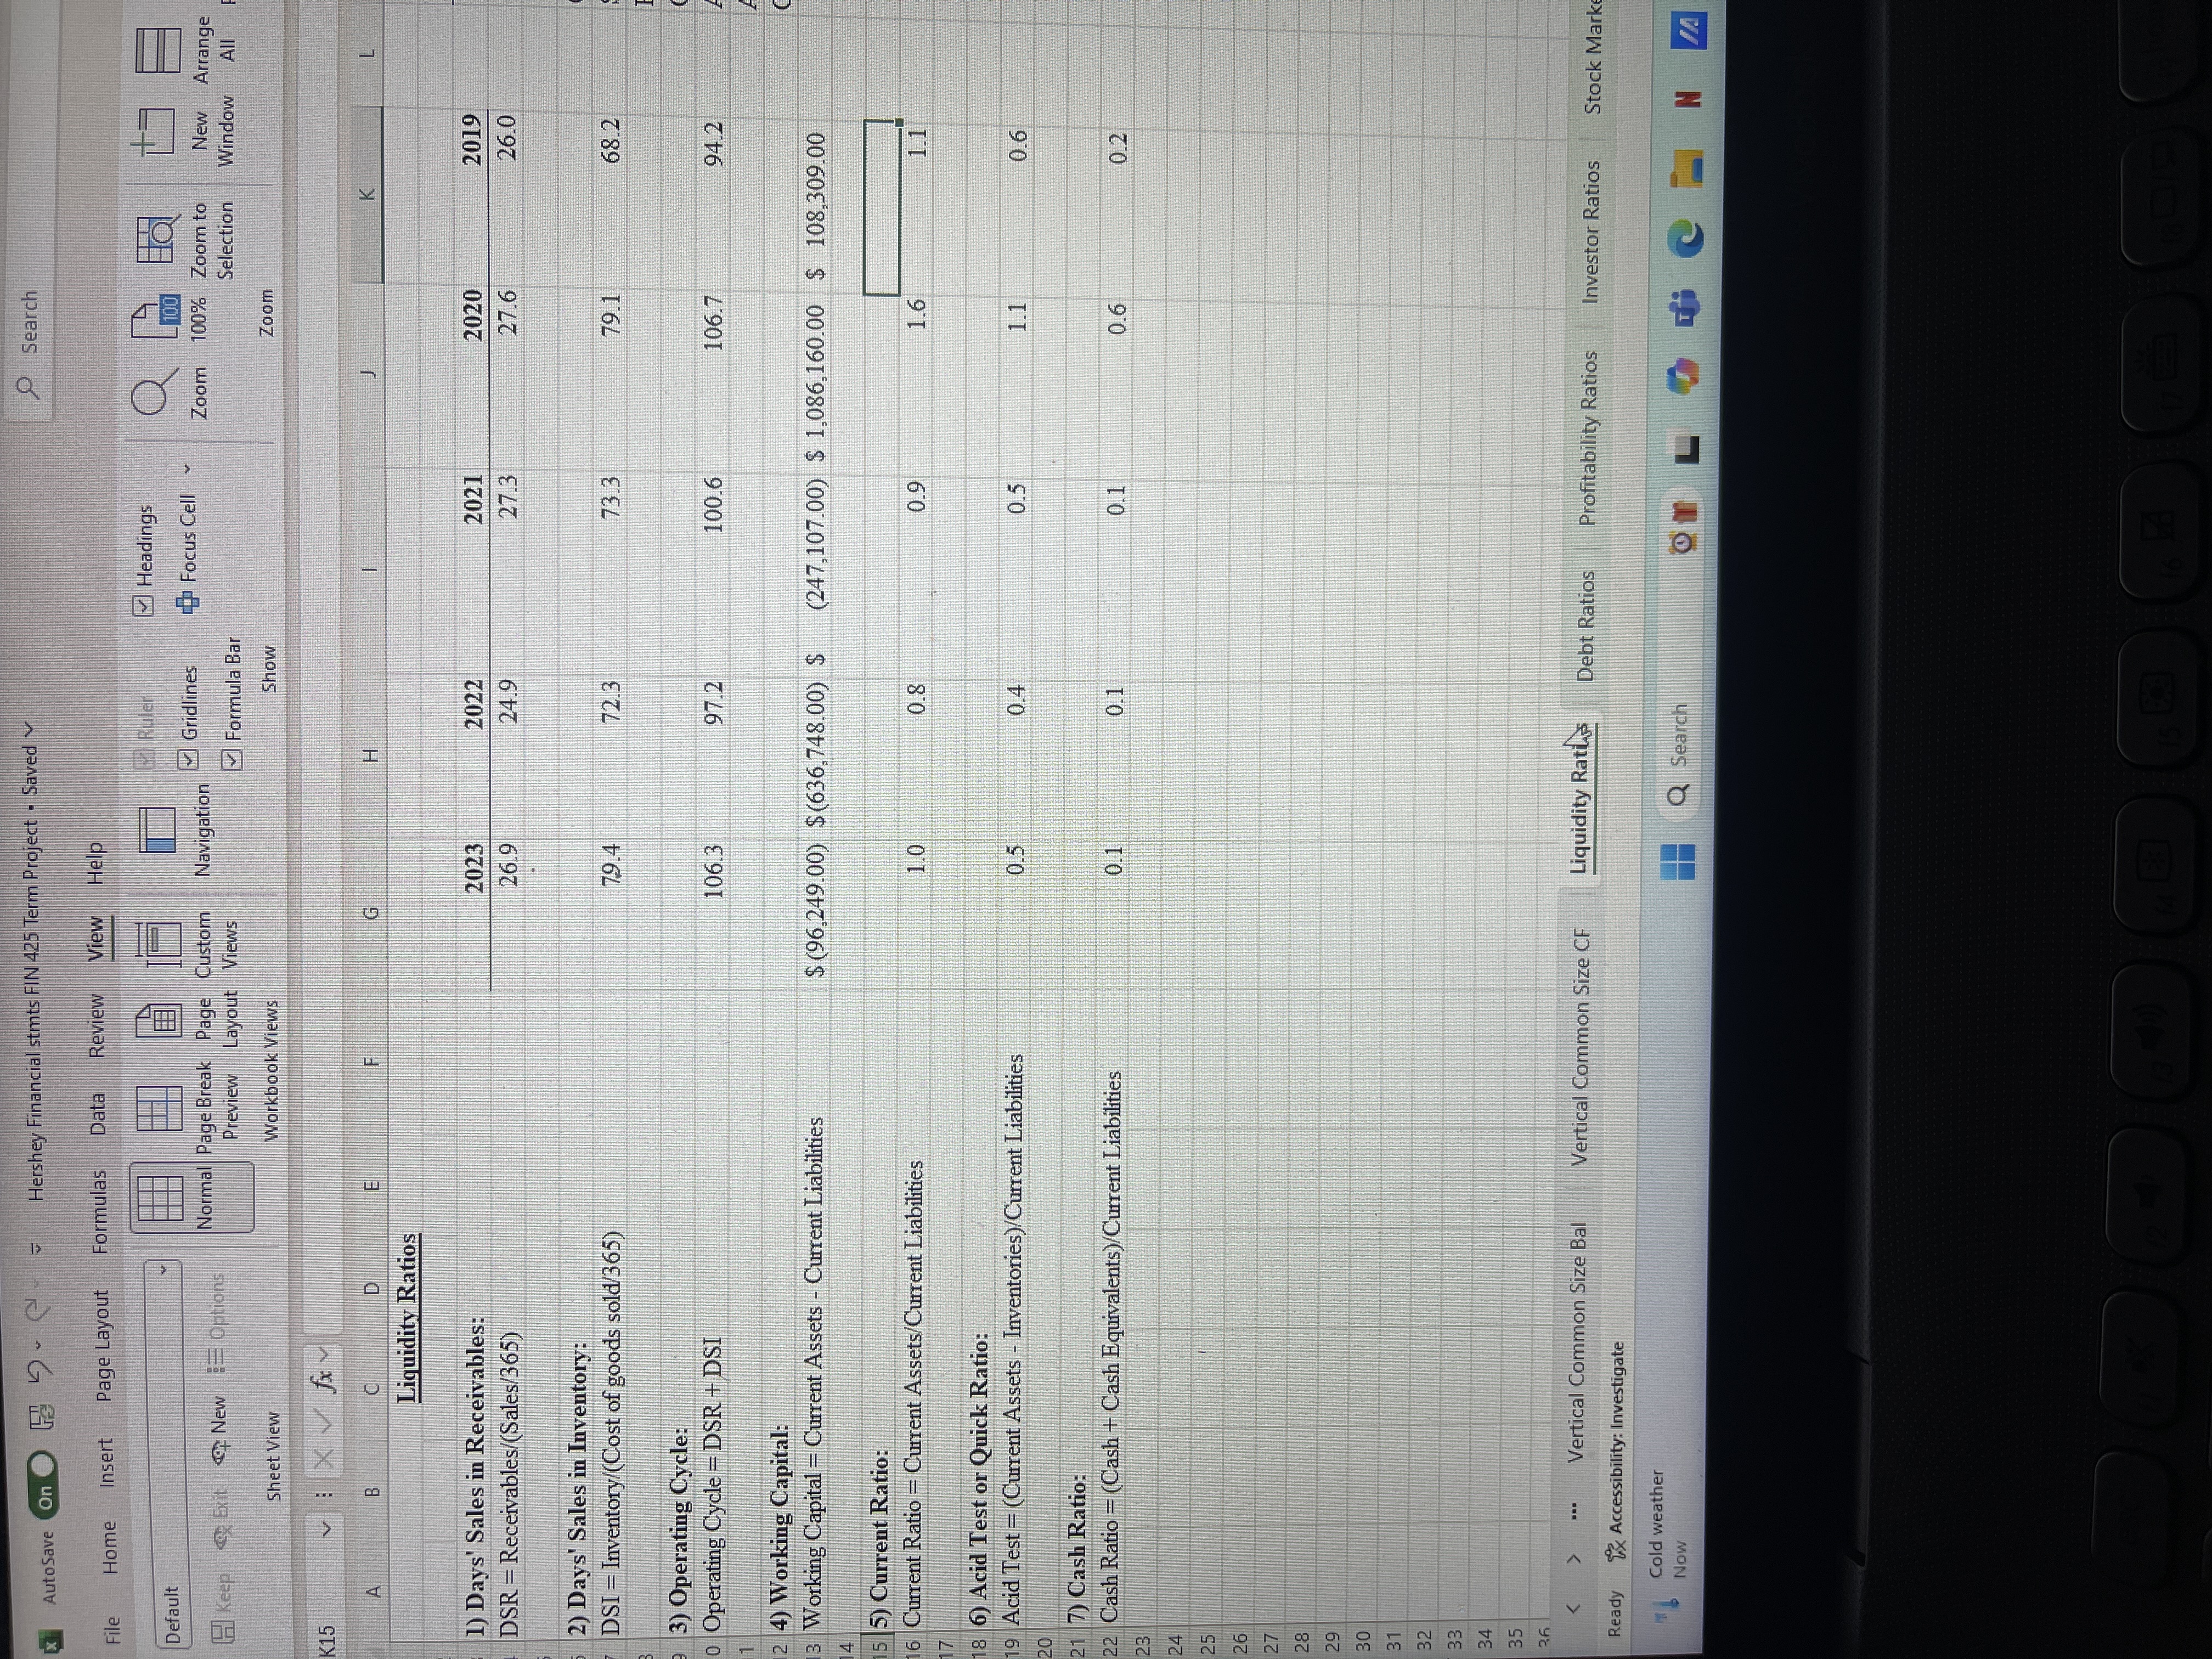
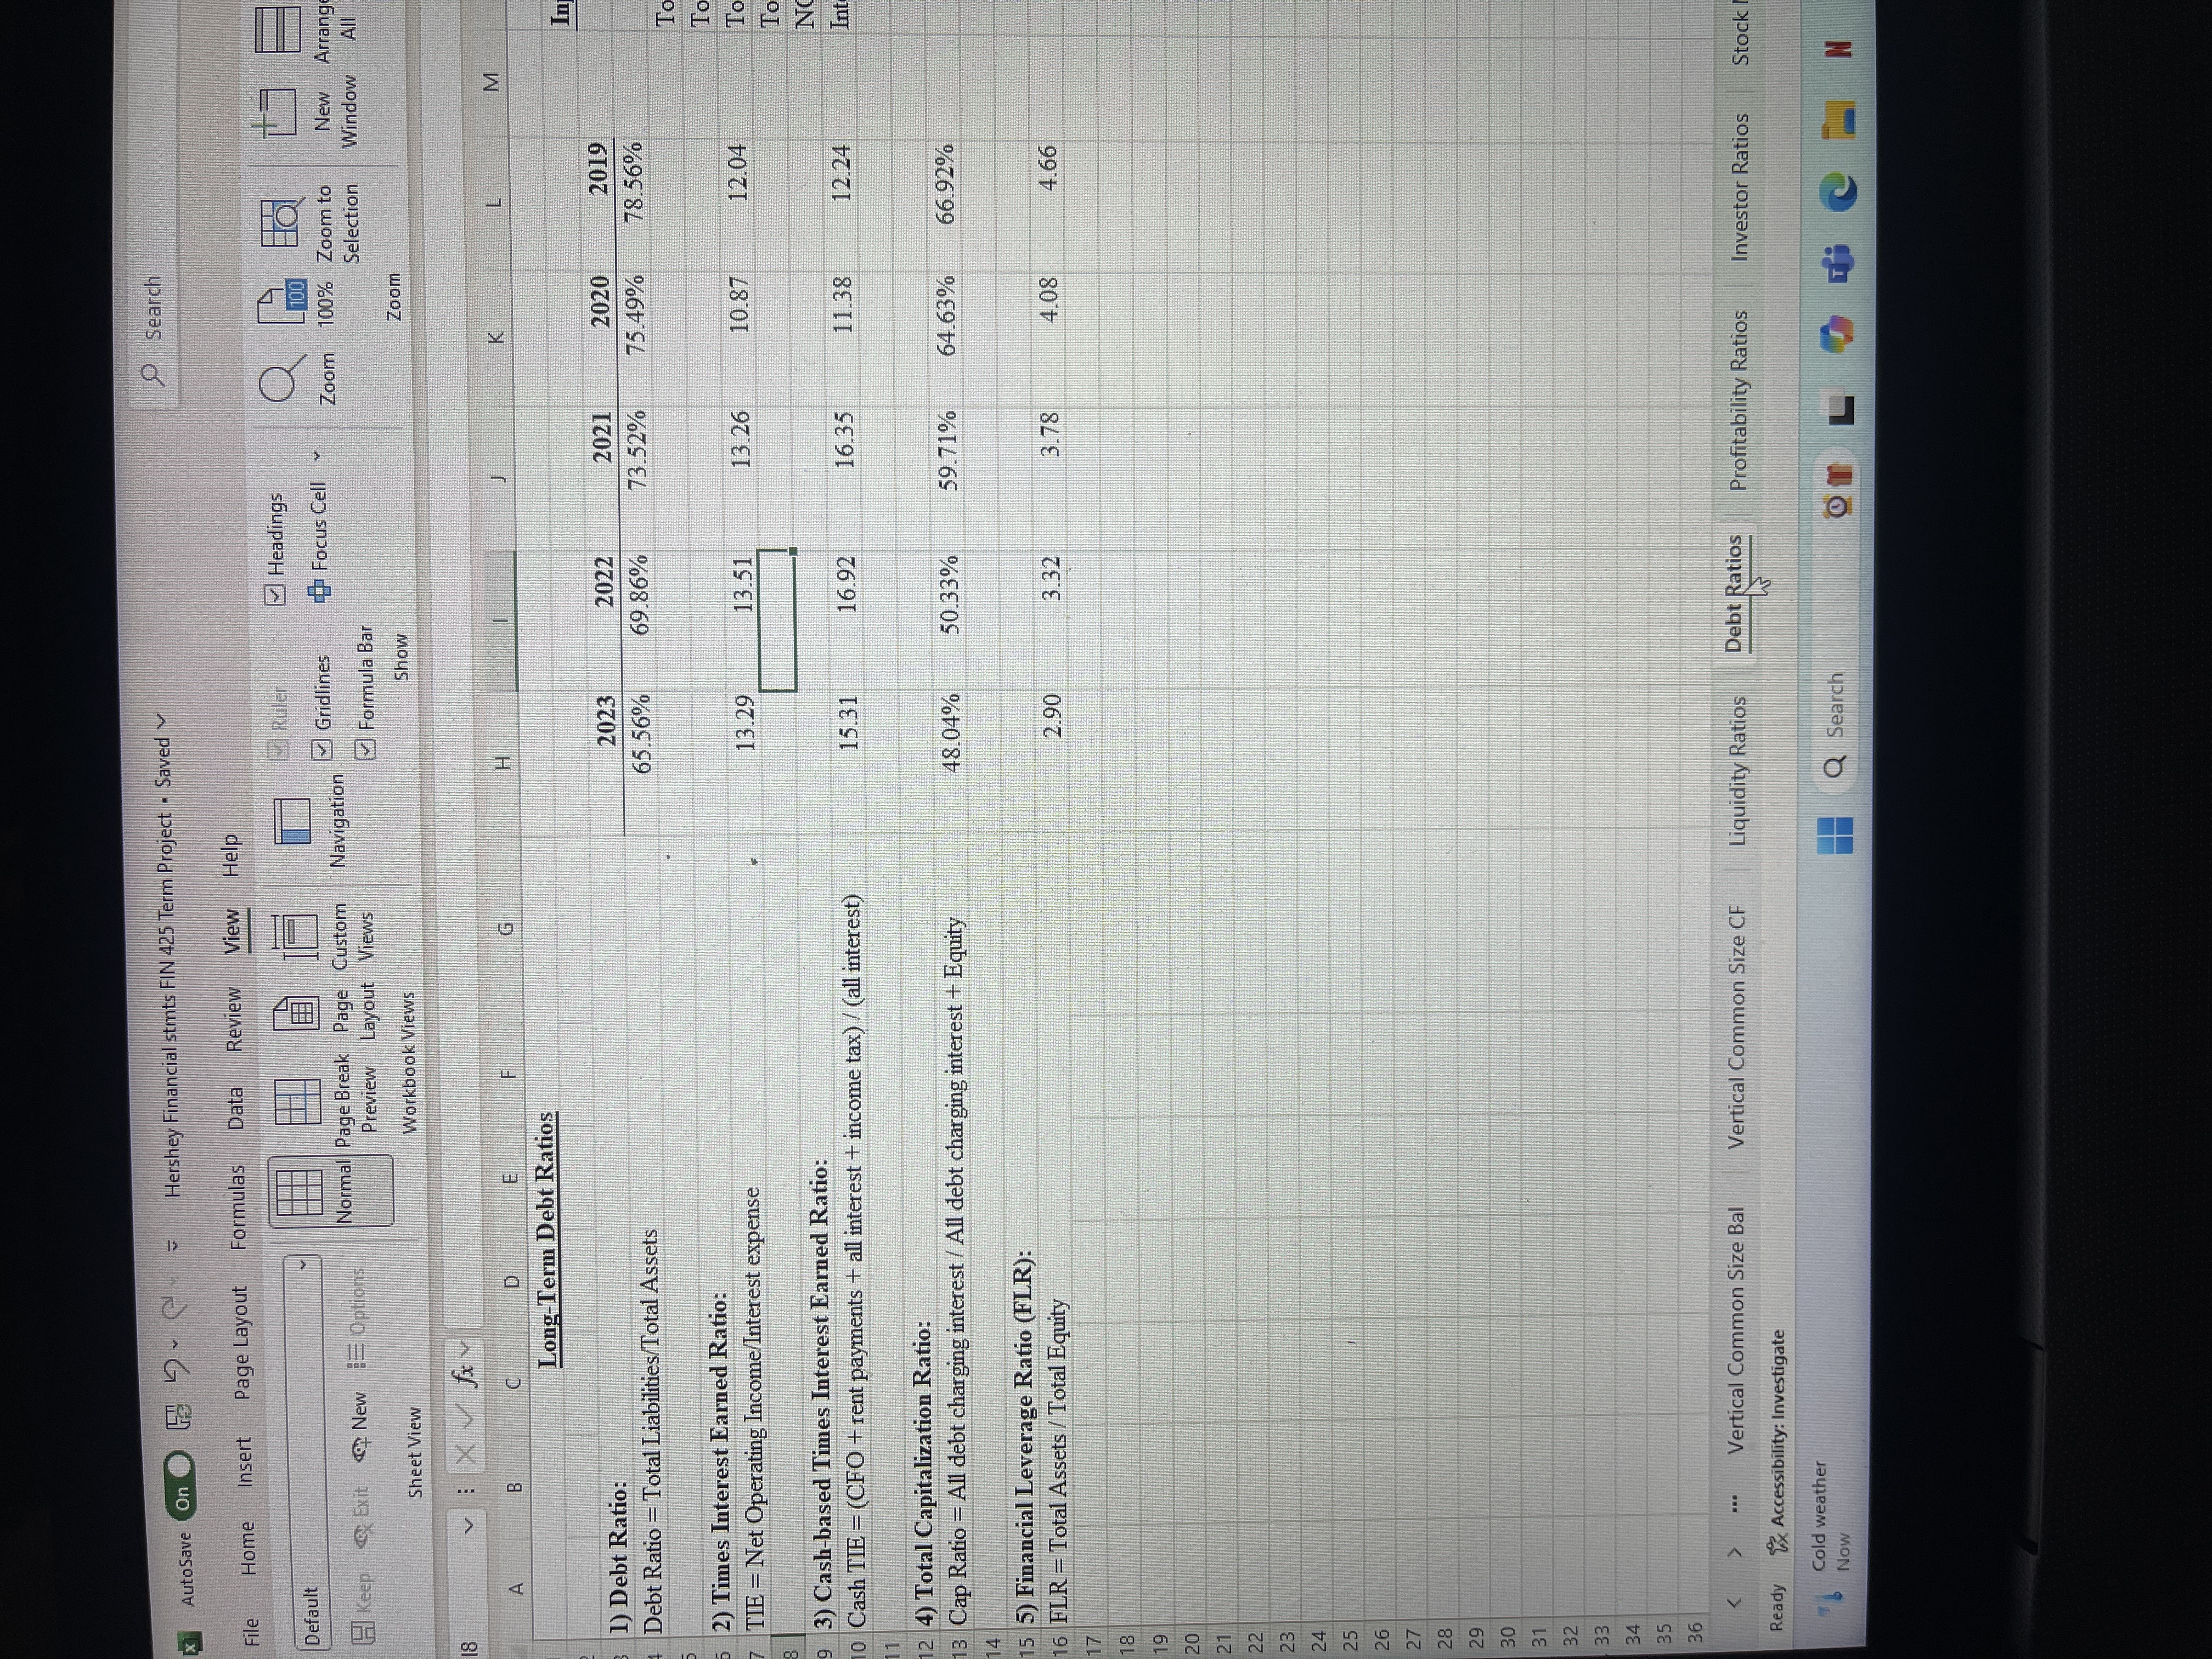
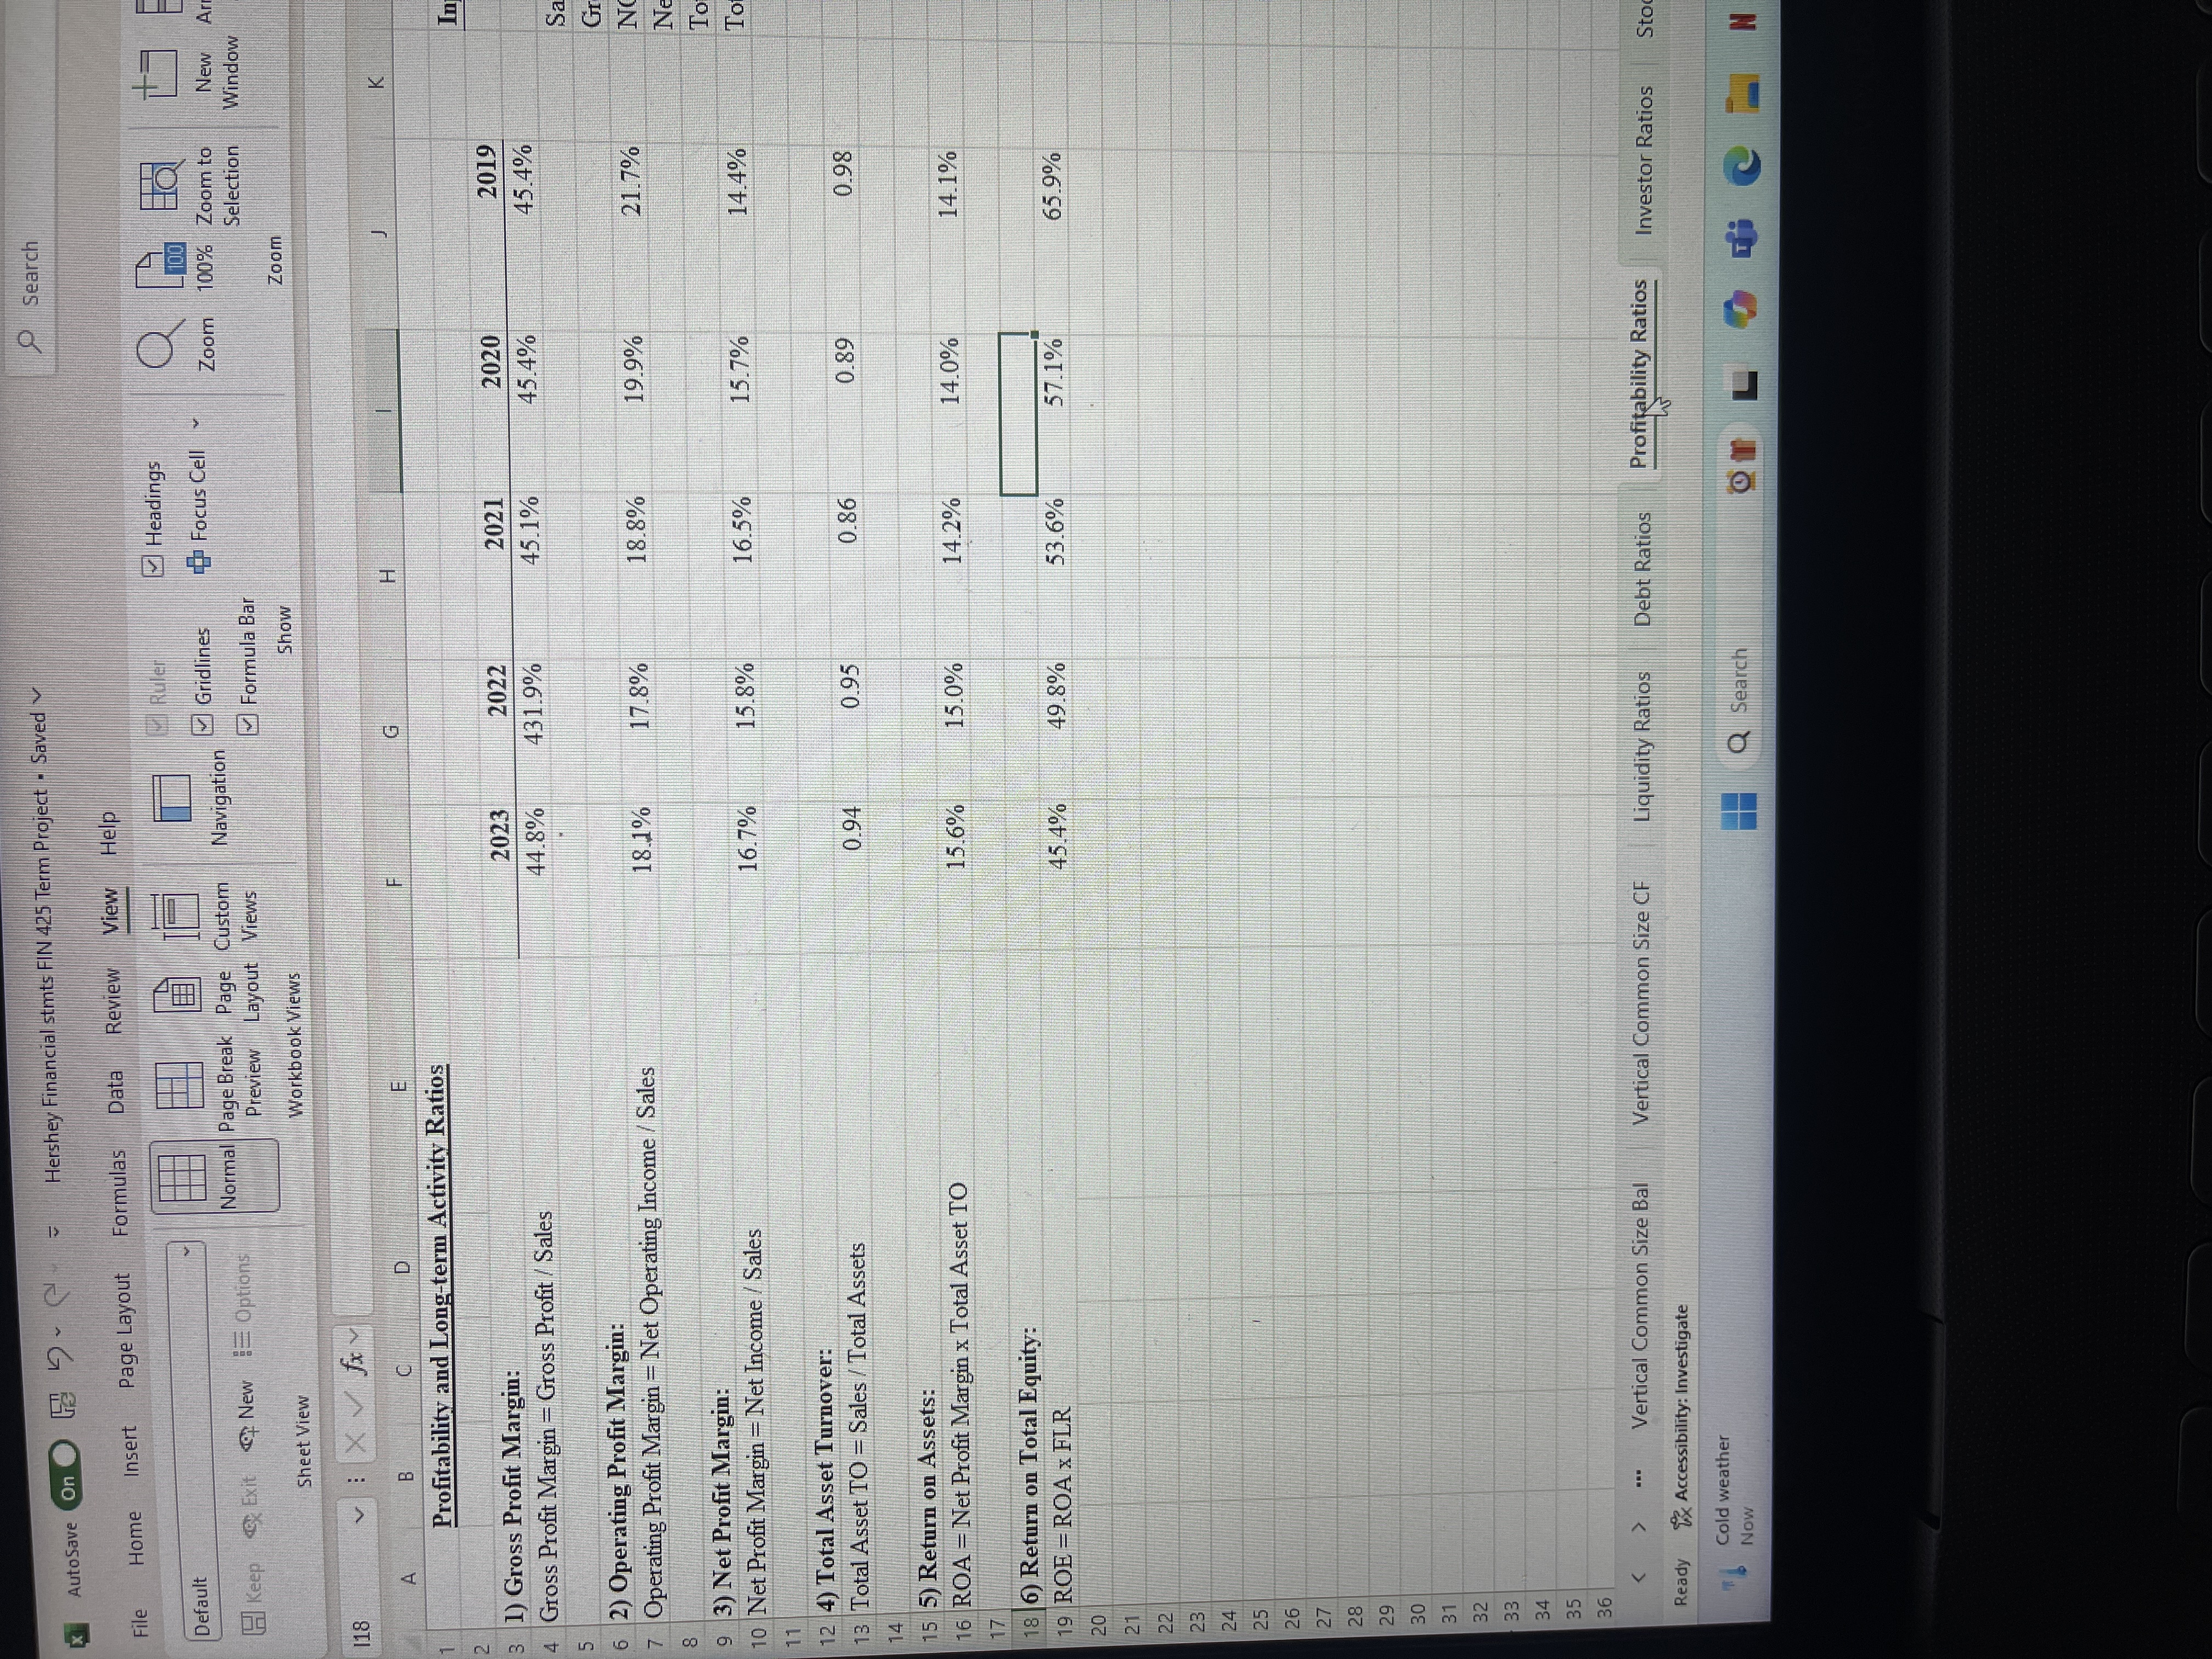
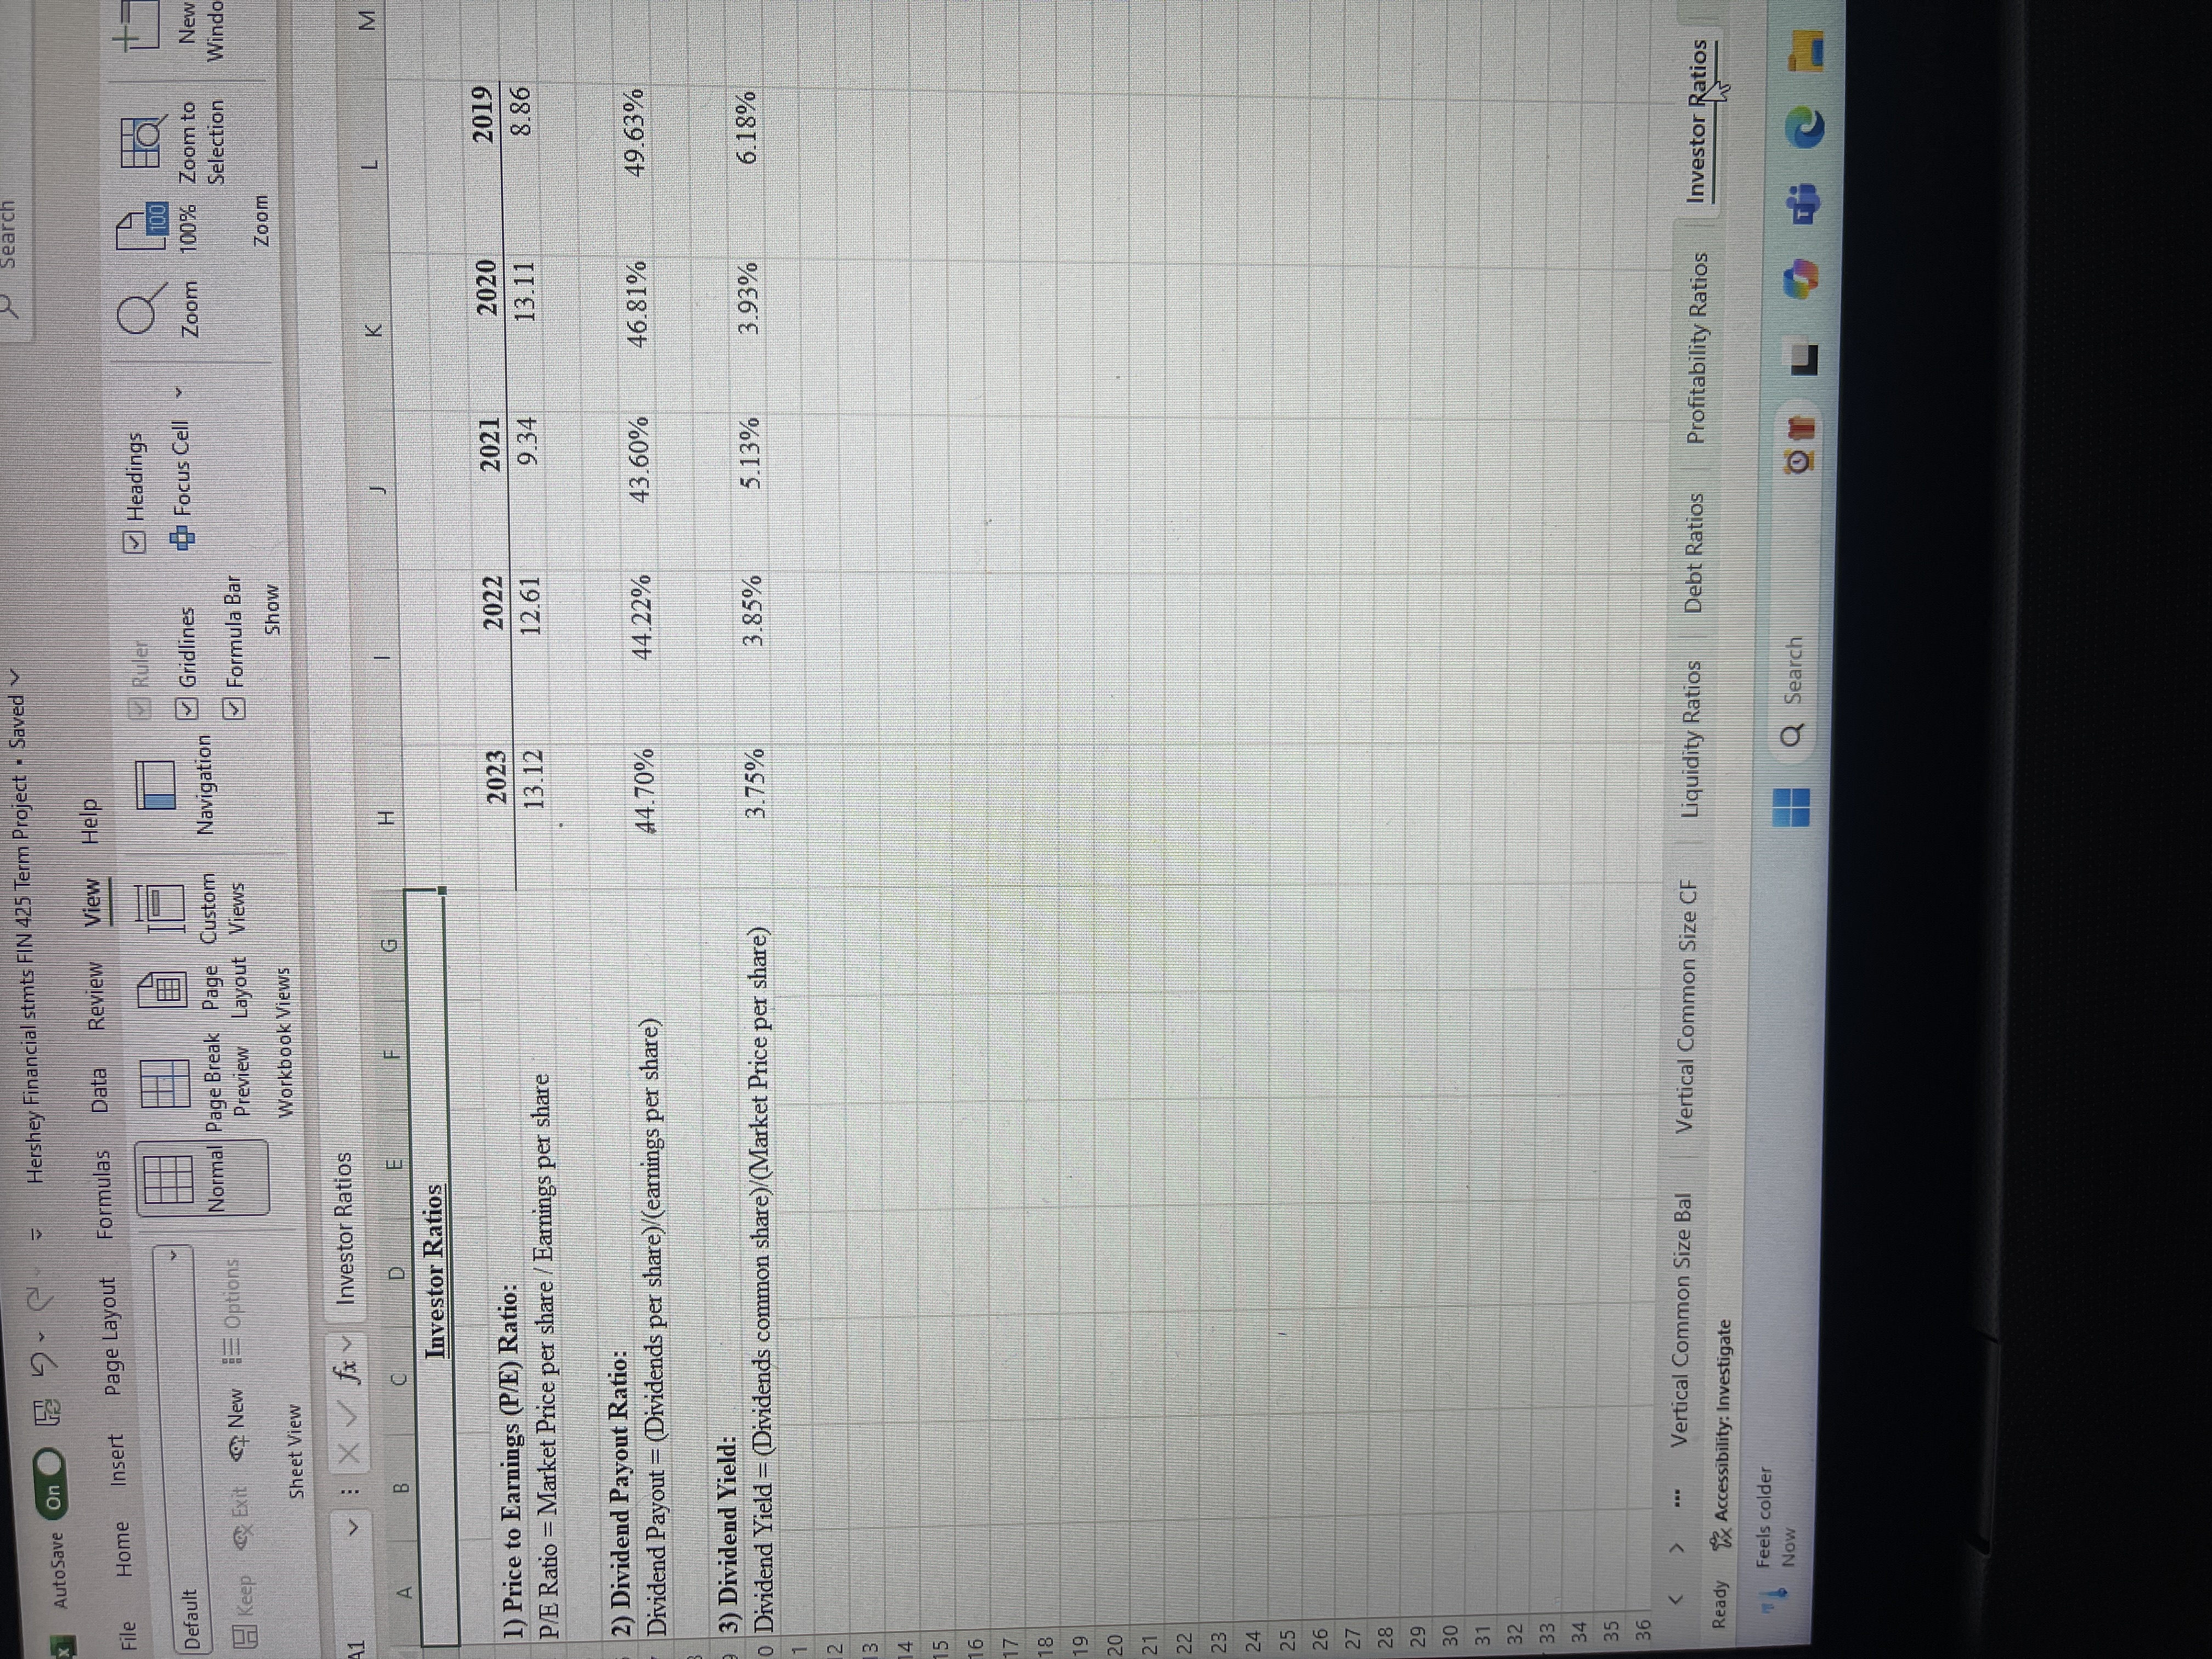
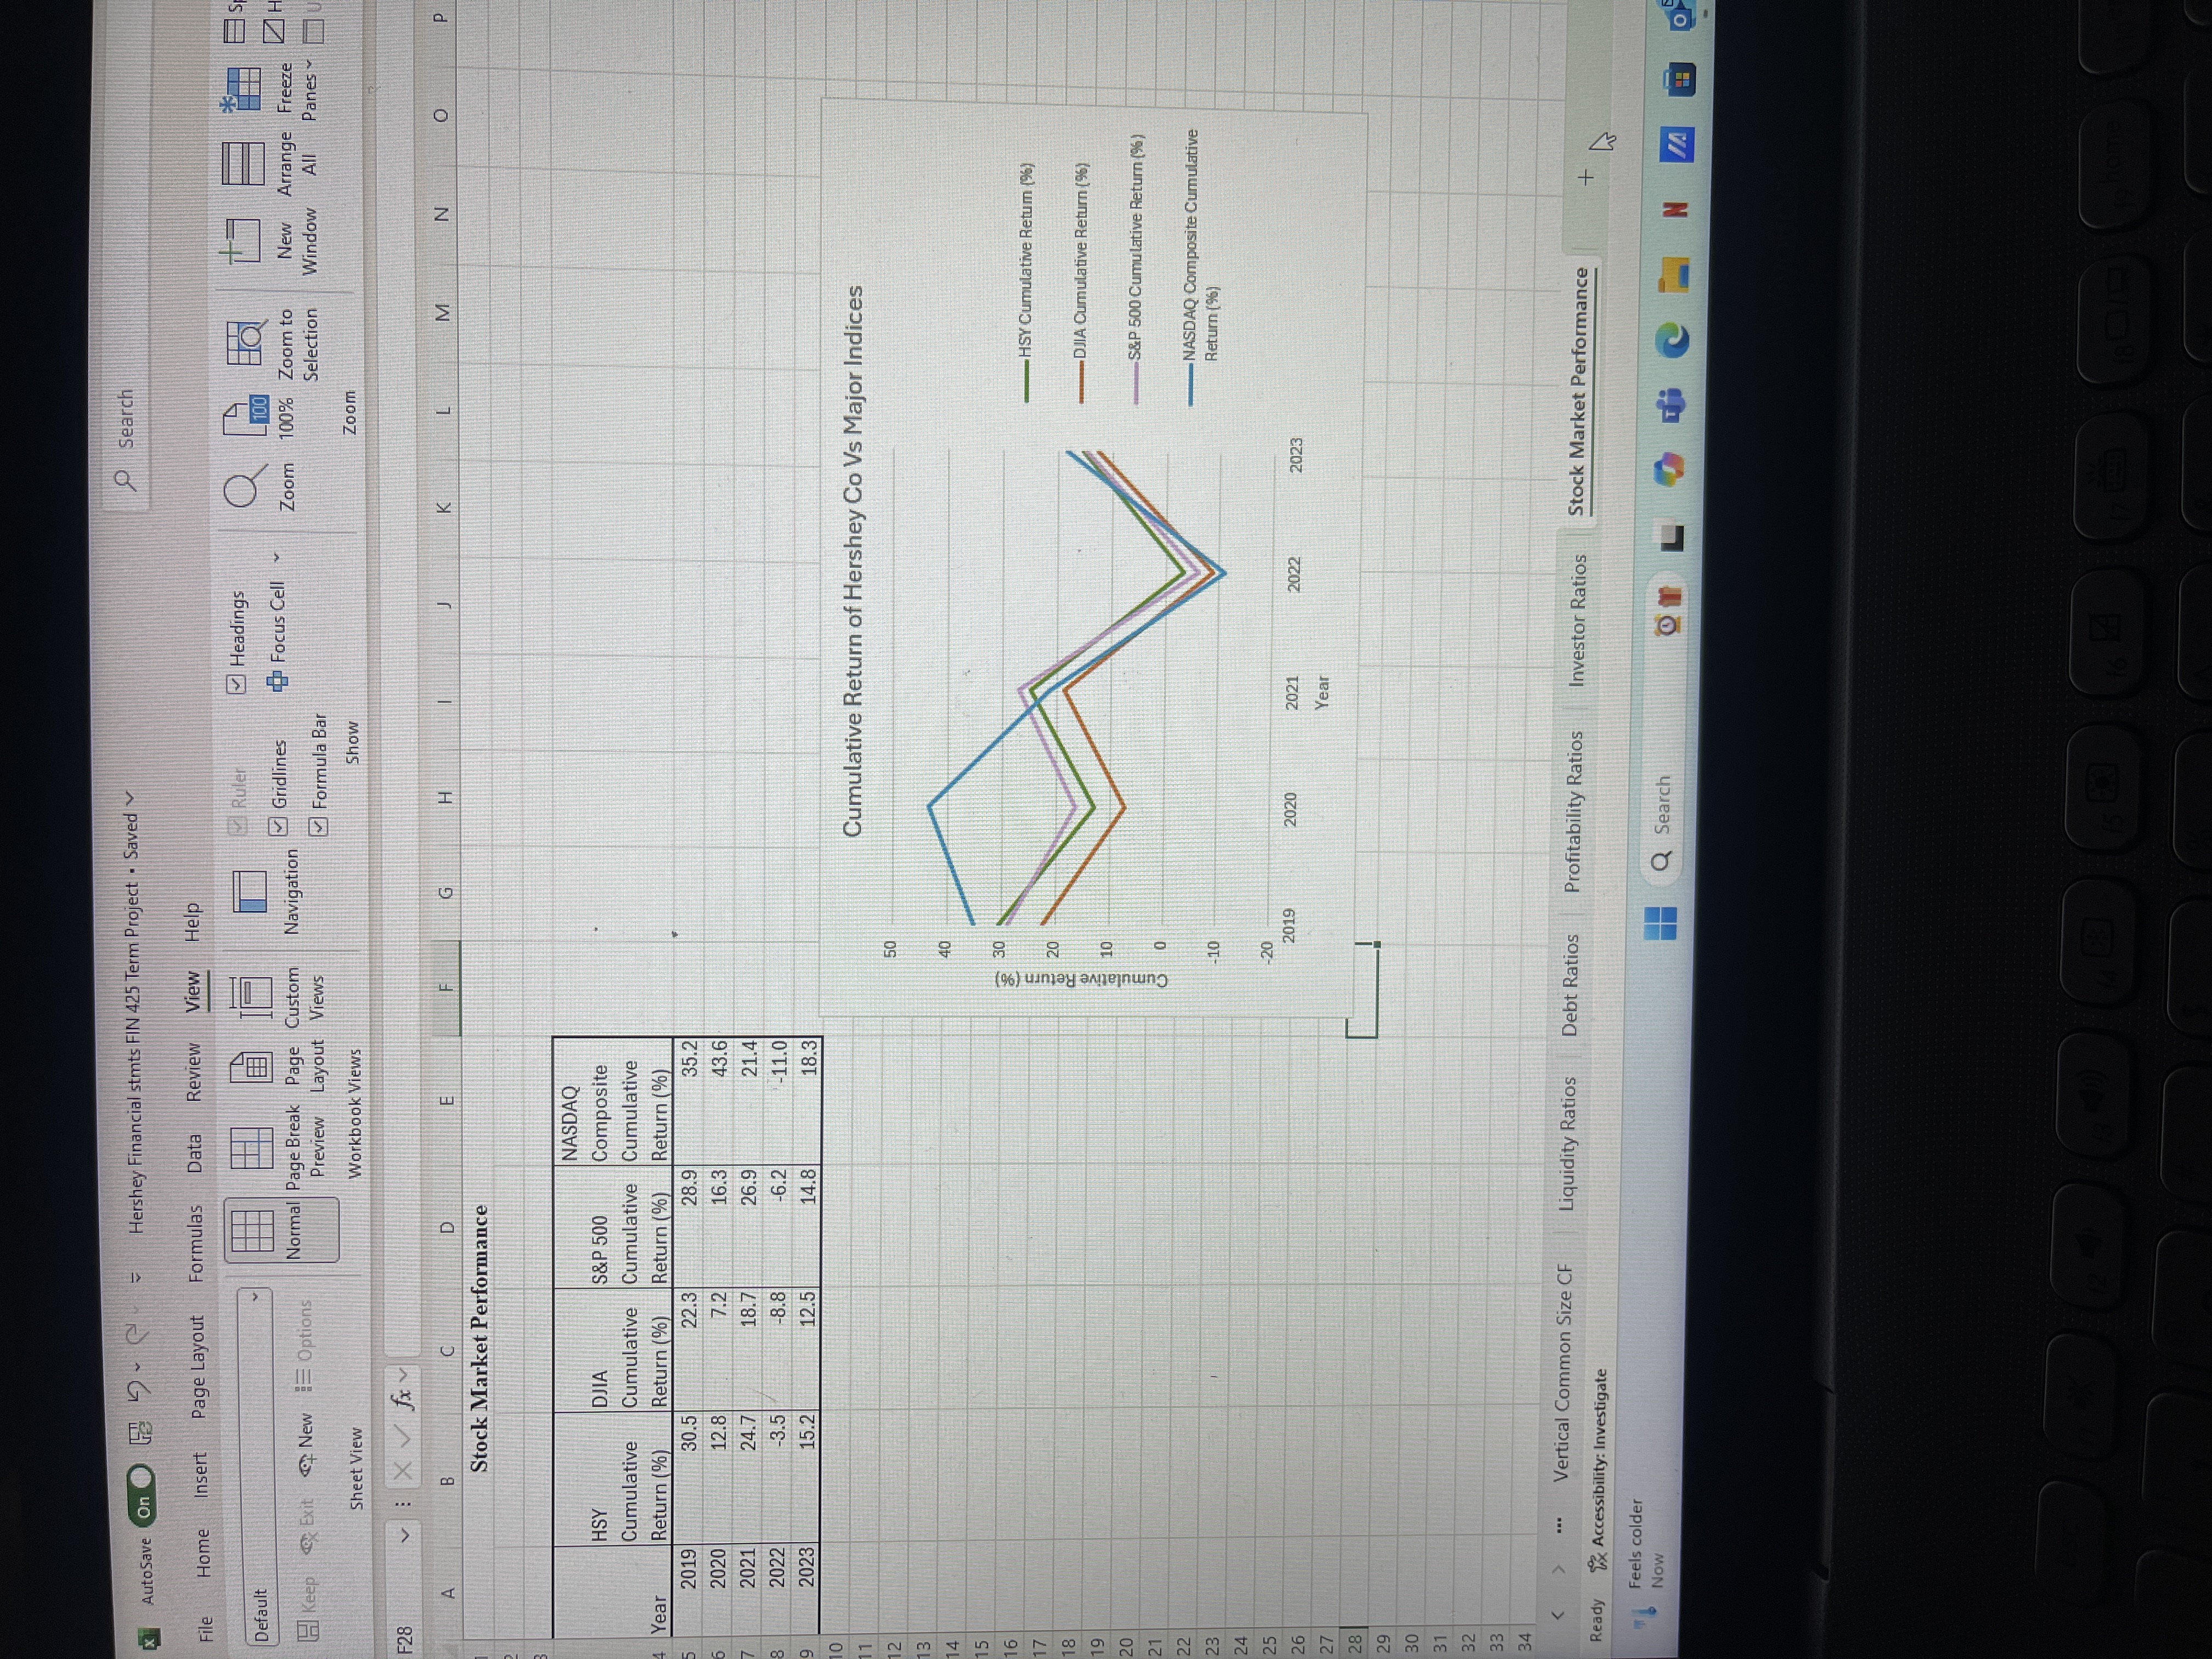
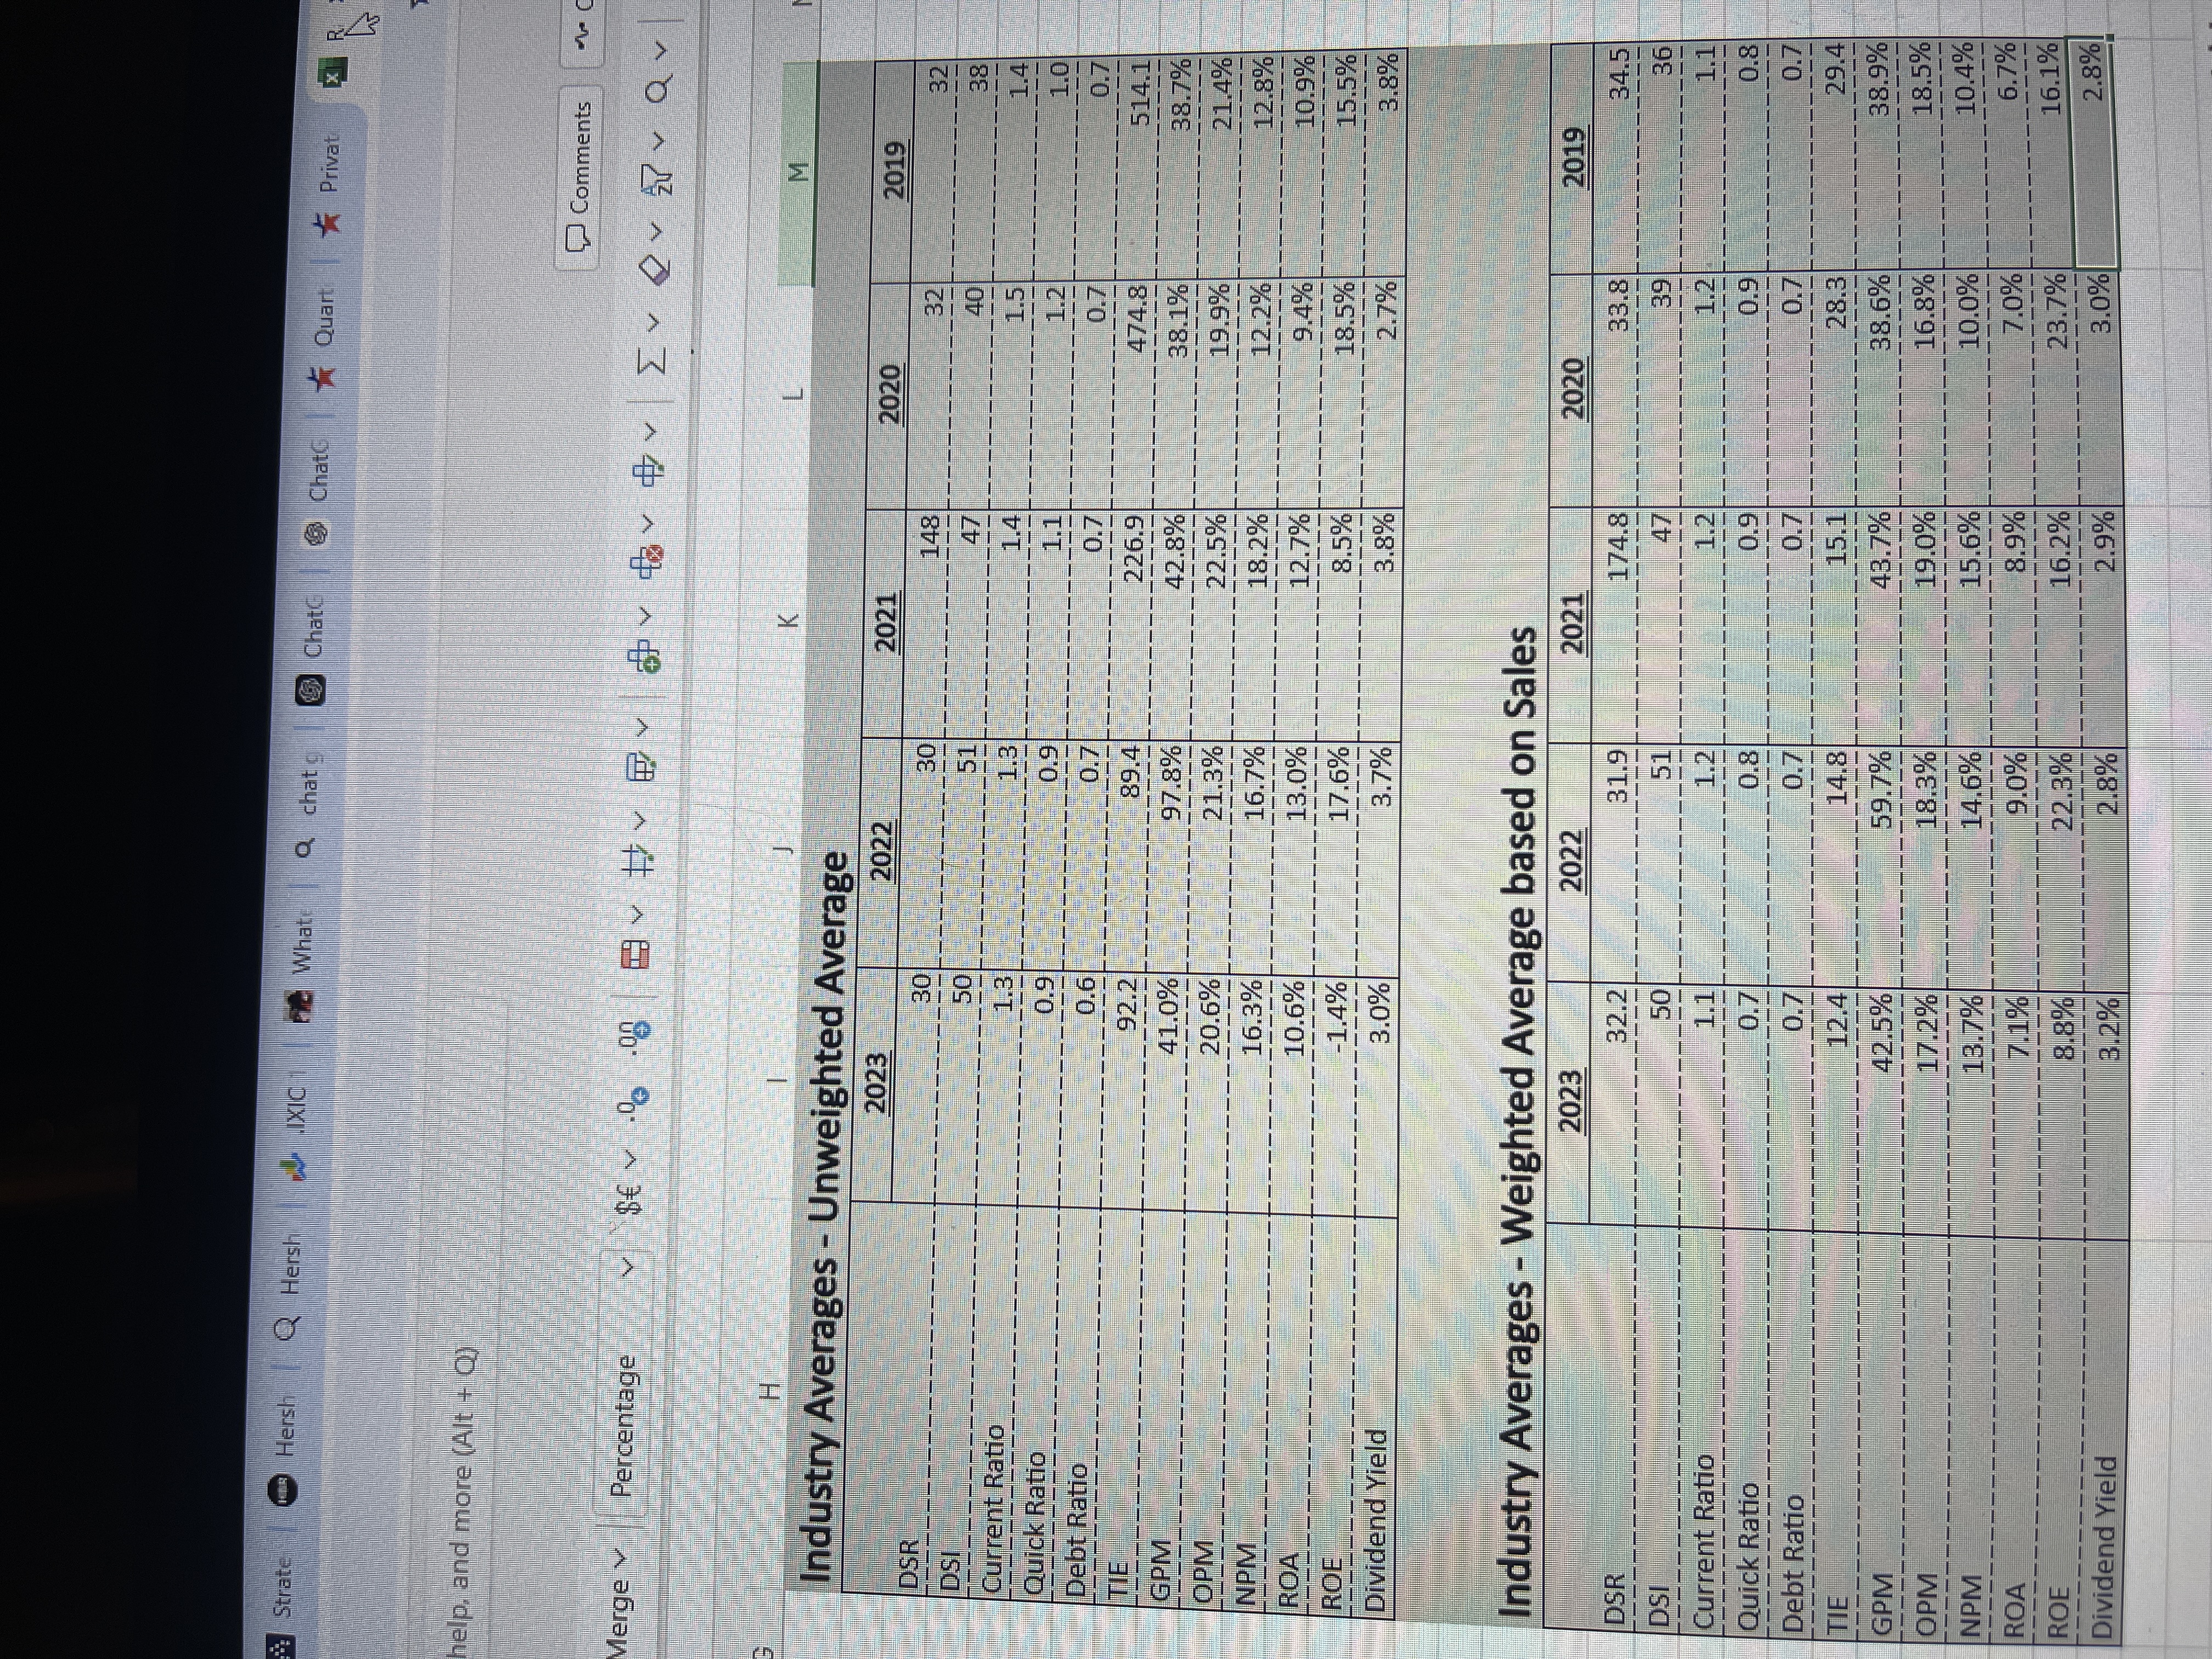
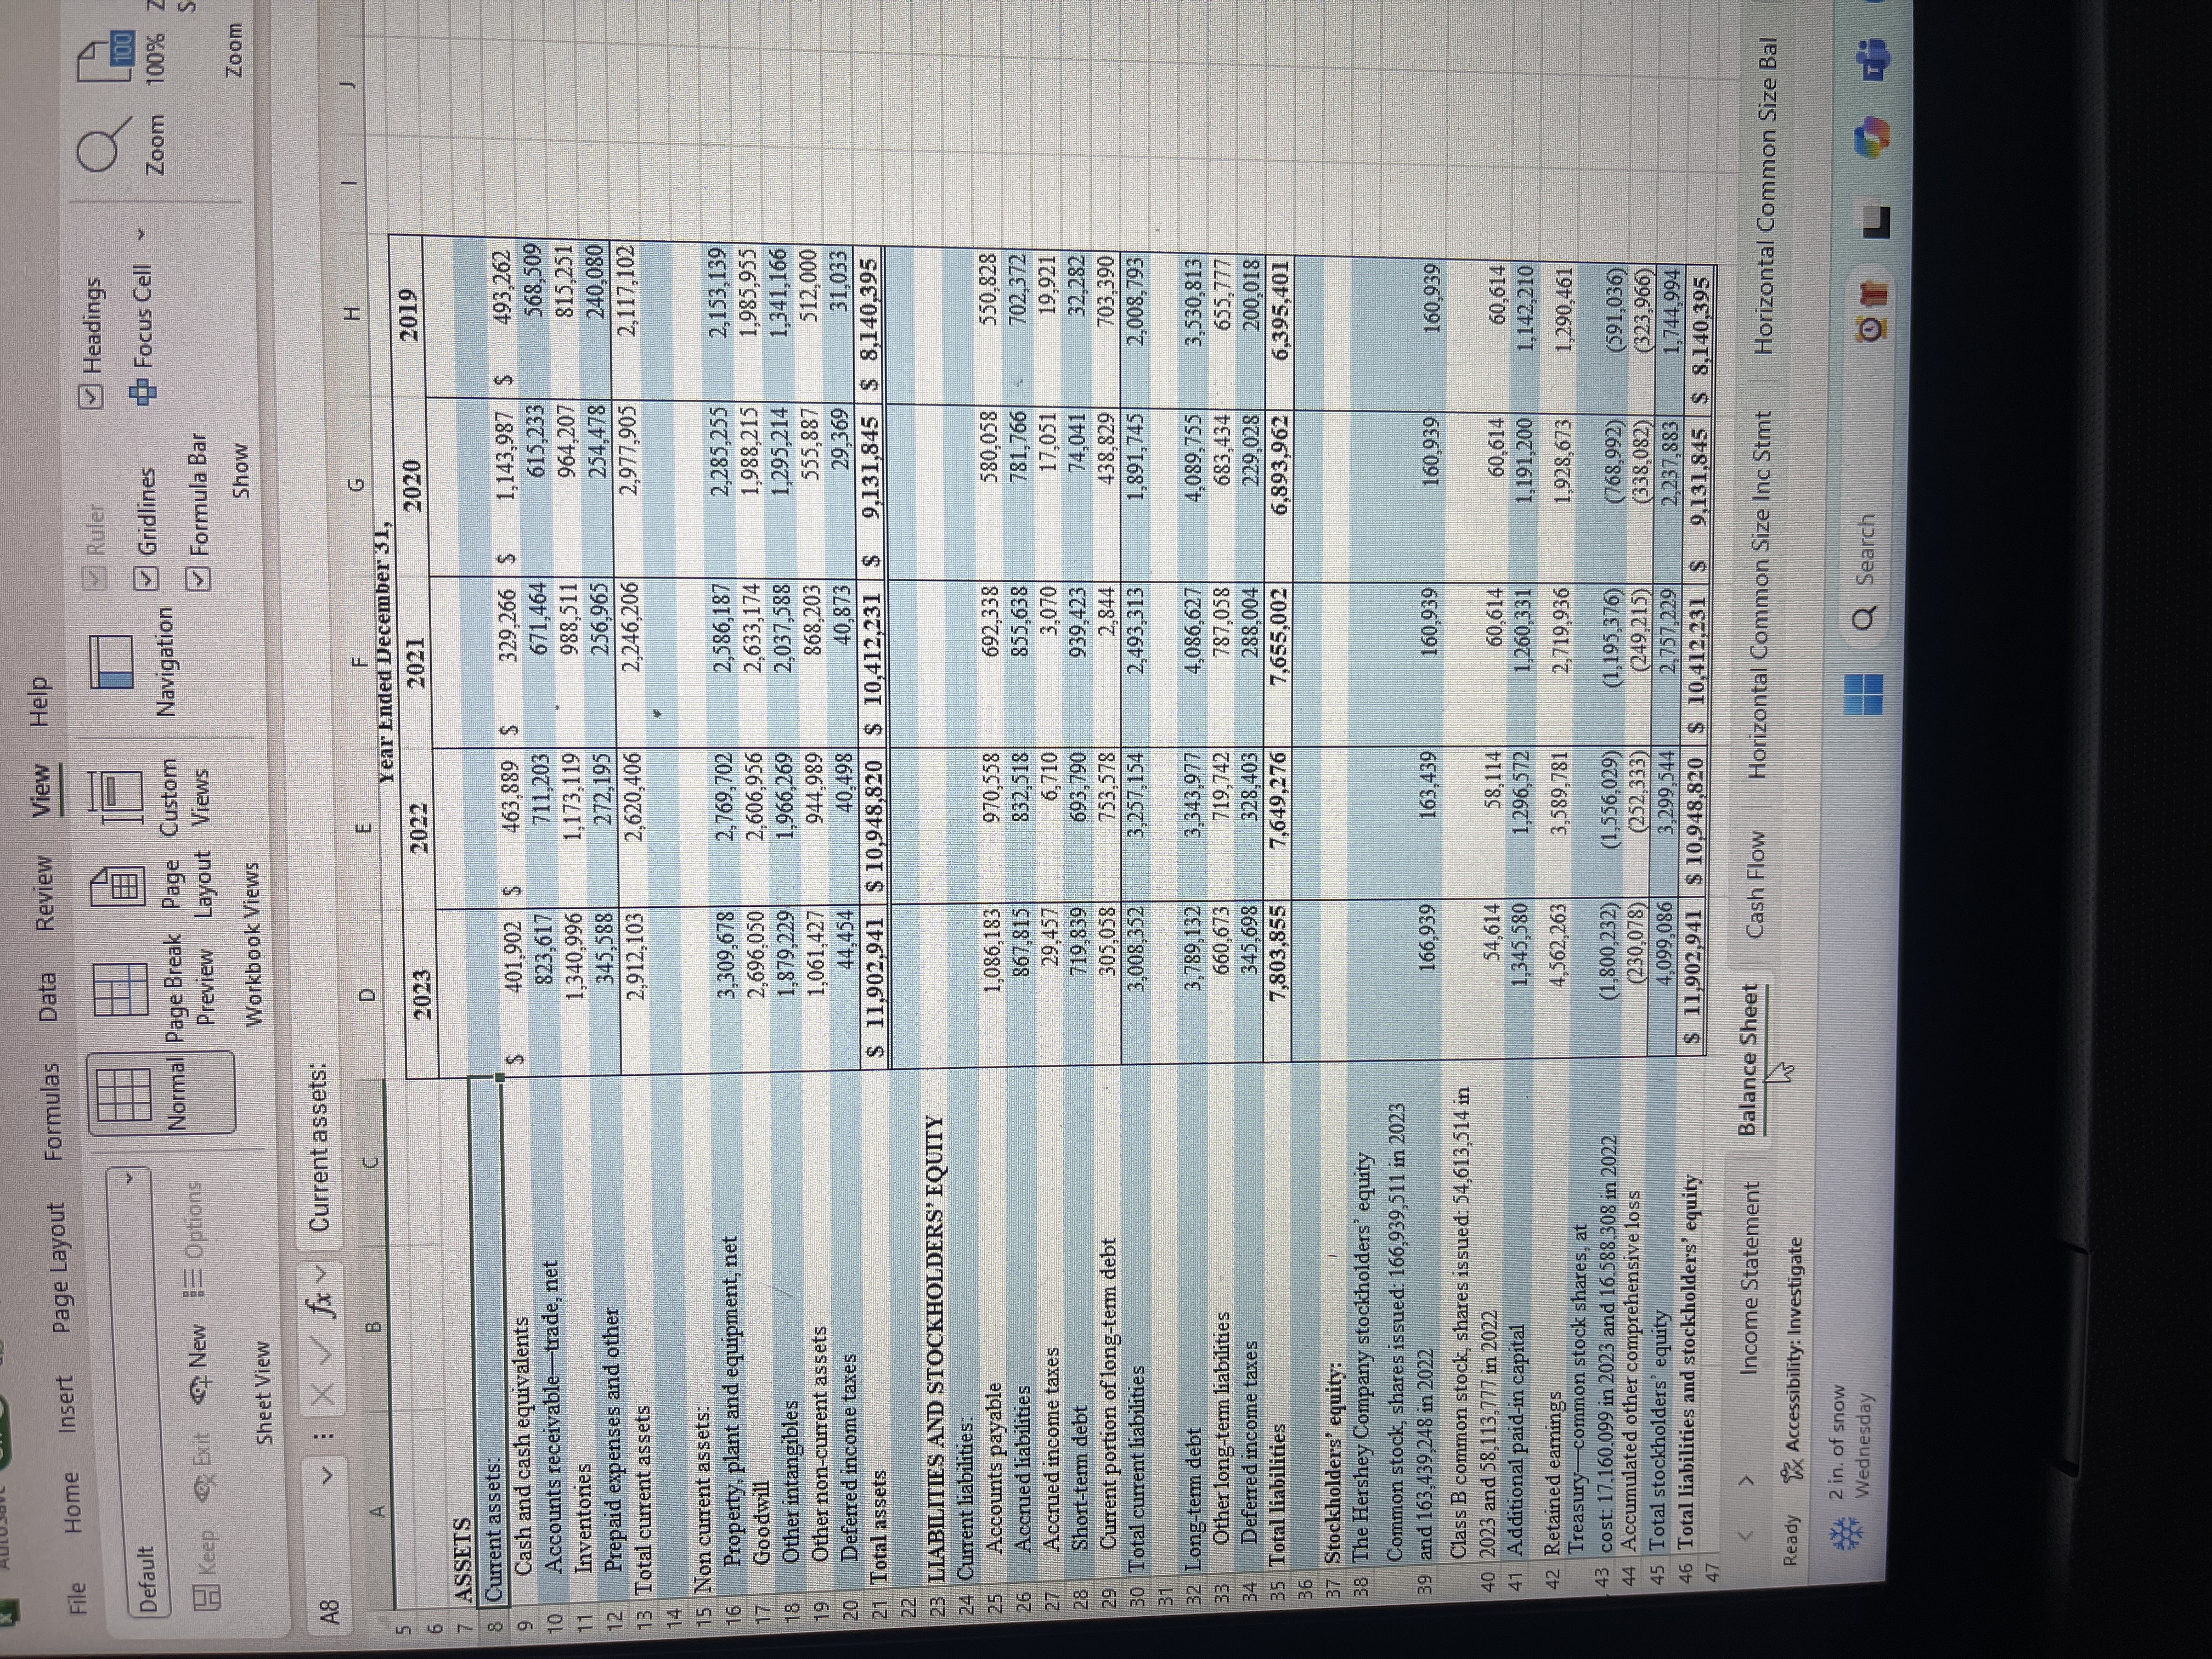
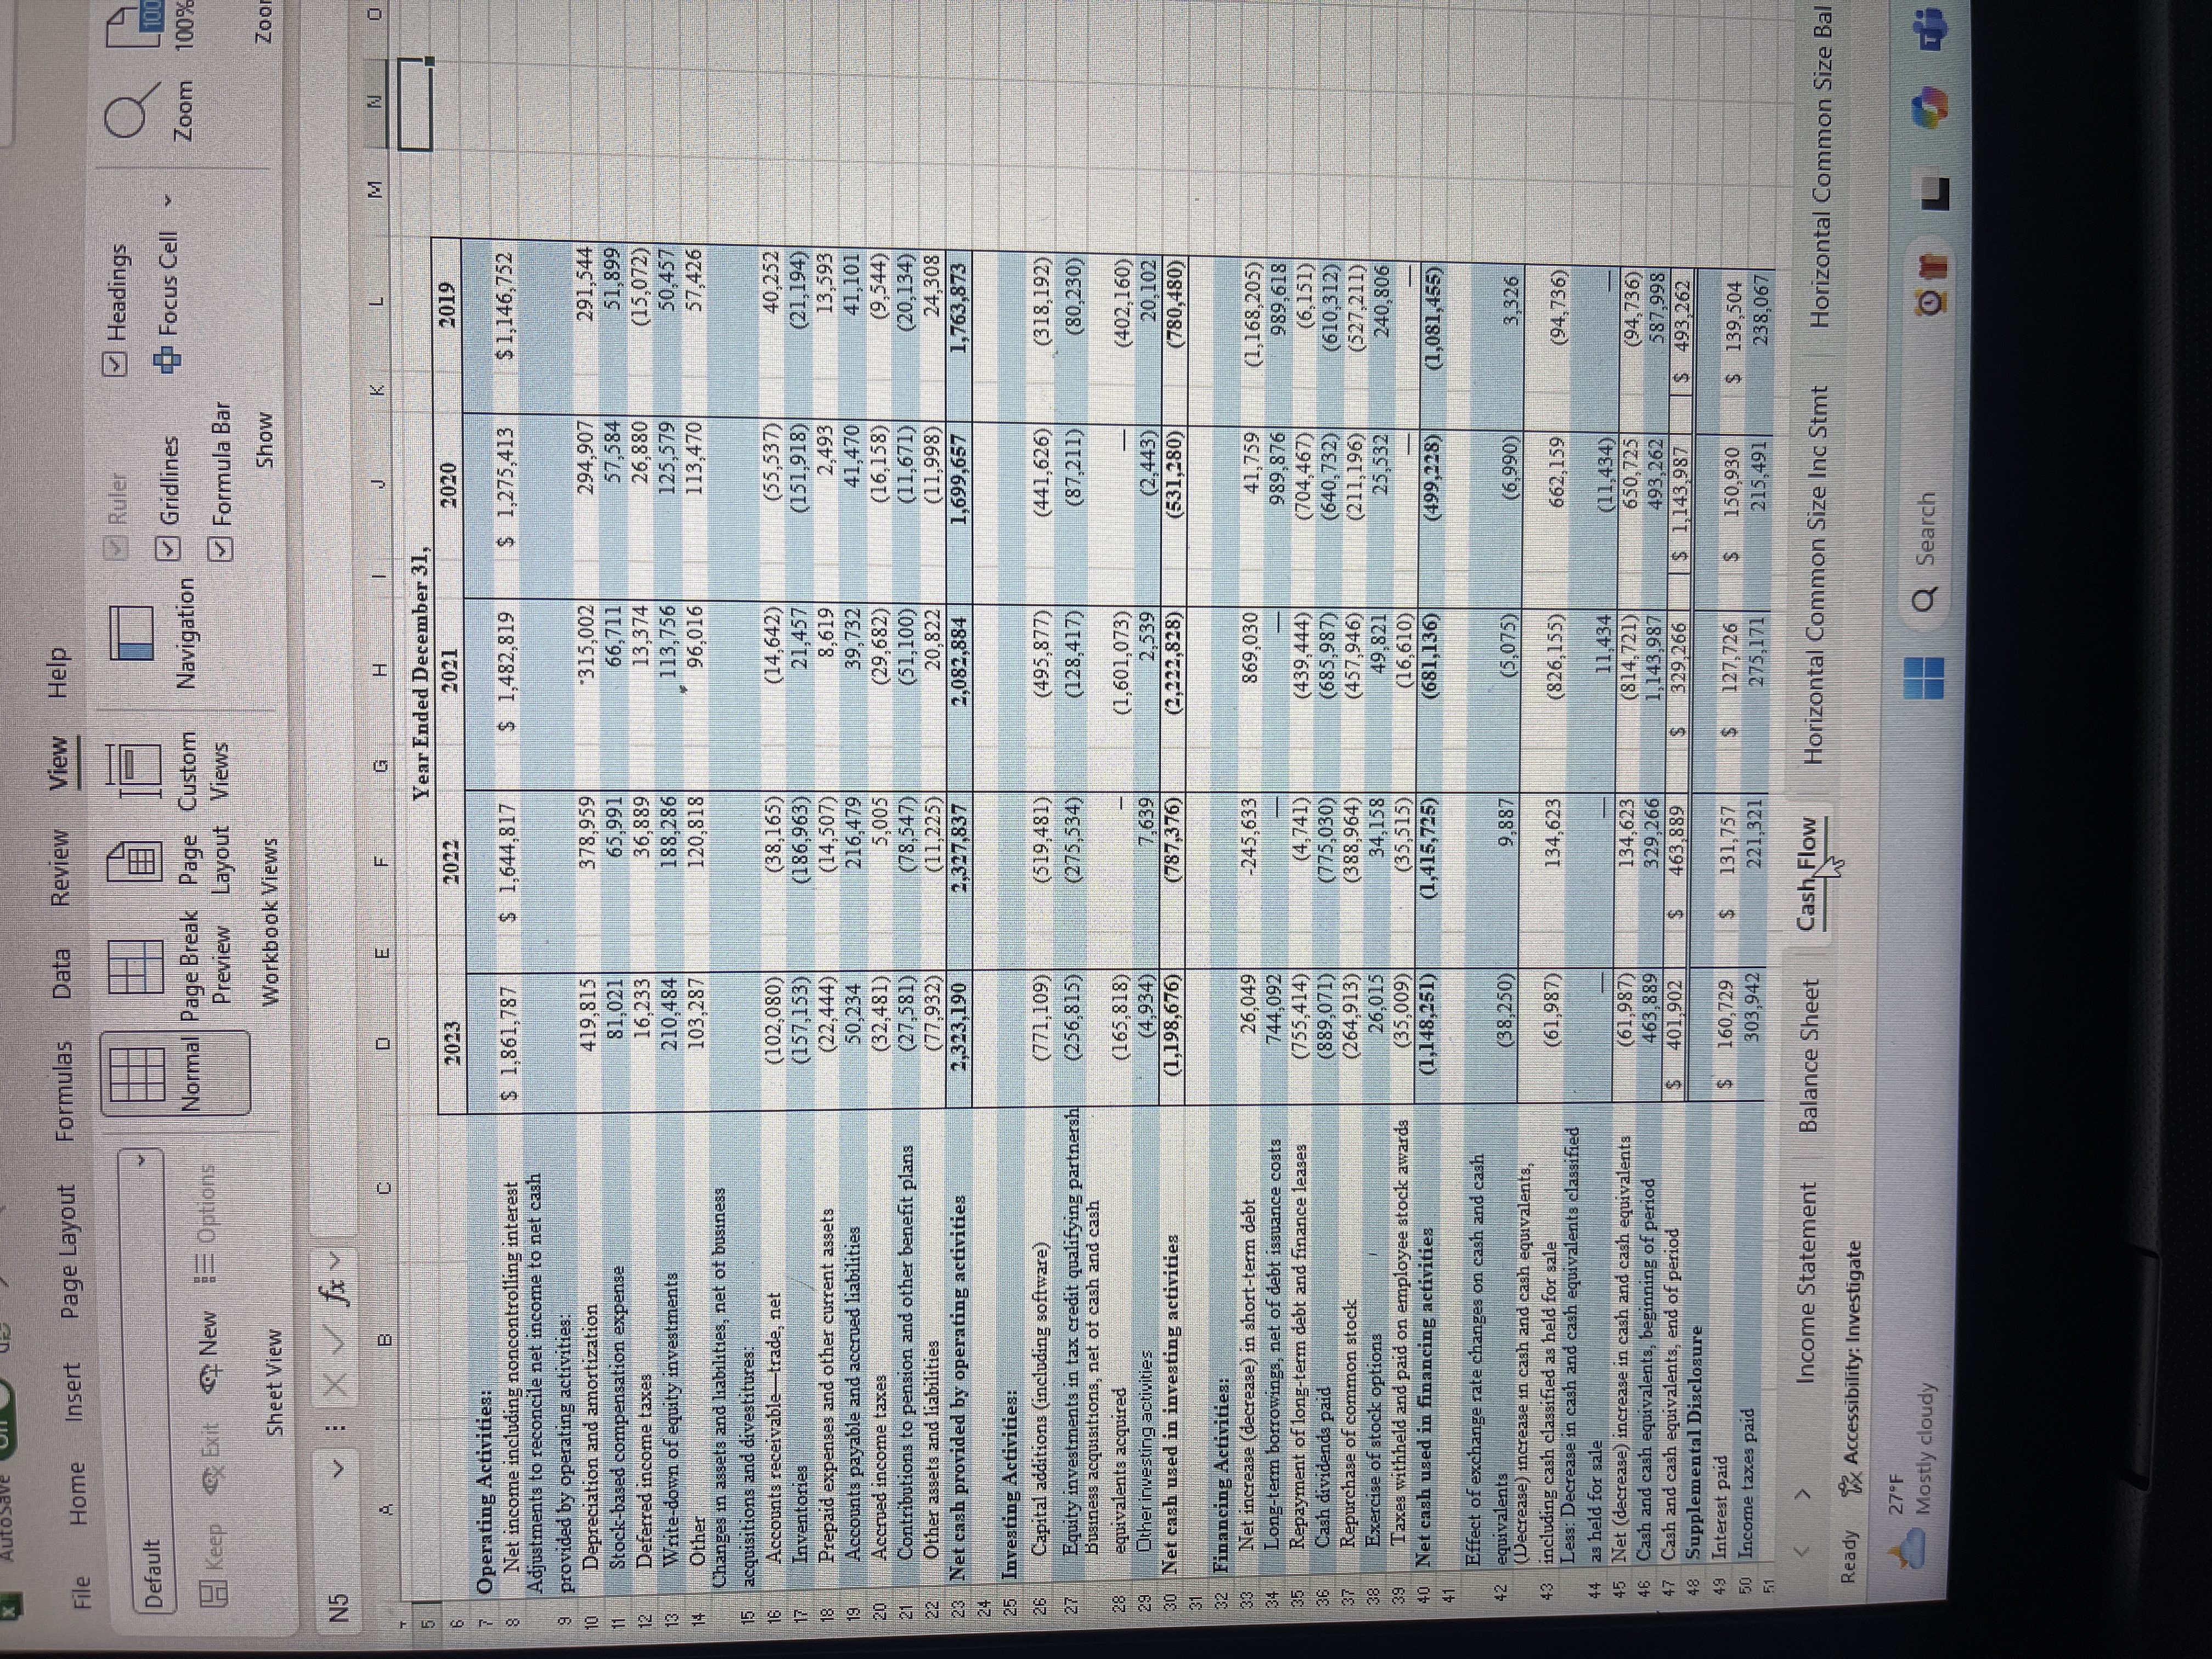
File Home Insert Page Layout Formulas Rul Headings Default Gridlines Focus Cell ~ Normal Page Break Page Custom Navigation Zoom 100% Zoom H Keep Exit New I Options Preview Layout Views Formula Bar Selec Workbook Views Show Zoom Sheet View C43 B D G H 4 5 Year Ended December 31 6 2023 2022 2021 2020 2019 7 Net Revenue $ 11,164,992 |$ 10,419,294 $ 8,971,337 $ 8,149,719 |$ 7,986,252 10 Cost of Goods Sold 6,167,176 5,920,509 4,922,739 4,448,450 4,363,774 11 12 Gross Profit 4,997,816 4,498,785 4:048,598 3,701,269 3,622,478 13 4 Operating Expenses: 15 Selling, marketing and administrative expense 2436508 2236009 2001351 1890925 1905929 Long-lived and intangible asset impairment 16 charges 9,143 112,485 17 Business Realignment costs 441 1,989 3,525 18,50 8,112 18 Operating profit 2,560,867 2,260,787 2,043,722 1,782,698 1,595,952 19 20 EBITDA 2,436,949 2,237,998 2,004,876 1,918,571 2,026,526 21 22 Depreciation and Amortization 419,815 378,959 315,002 294,907 291,544 23 24 NO 2,017,134 1,859,039 1,689,874 1,623,664 1,734,982 25 26 Other income/expense: 27 Other (income) expense, net 237,218 206,159 119.08 138,327 71,043 28 29 EBIT 2,254,352 2,065,198 1,808,955 1,761,991 1,806,025 30 31 Interest Expense 151,785 137,557 127,417 149 374 144,125 32 33 EBT 2,171,864 1,917,071 1,797,224 1,494,997 1,380,784 34 35 Provision for Income Taxes 310,077 272,254 314,405 36 219 584 234,032 37 Net income including noncontrolling interest 1,861,787 1,644,817 1,482,819 1,275,413 Less: Net gain attributable to 1,146,752 38 noncontrolling interest 30 5.307 (3,295 (2,940) Net Income attributable to The Hershey Company 1,861,787 $ 41 1,644,817 $ 1,477.512 $ 1,278,708 $ 1,149,692 47 Income Statement Balance Sheet Cash Flow Horizontal Common Size Inc Stmt Horizontal Common Size Bal Ready Accessibility: Investigate 27. F Mostly cloudy Search ofLx AutoSave On - - Hershey Financial stmts FIN 425 Term Project - Saved Search Formulas View Help File Home Insert Page Layout Data Review Headings Default Gridlines Zoom 100% Zoom to Keep Exit New Options Normal Page Break Page Custom Navigation Focus Cell New Arrange Preview Layout Views Formula Bar Selection Window All Sheet View Workbook Views Show Zoom 15 A B G H Liquidity Ratios 1) Days' Sales in Receivables: 2023 2022 2021 2020 2019 DSR = Receivables/(Sales/365) 26.9 24.9 27.3 27.6 26.0 2) Days' Sales in Inventory: DSI = Inventory/(Cost of goods sold/365) 79.4 72.3 73.3 79.1 58.2 3) Operating Cycle: Operating Cycle = DSR + DSI 106.3 97.2 100.6 106.7 94.2 2 4) Working Capital: 3 Working Capital = Current Assets - Current Liabilities $ (96,249.00) $ (636,748.00) $ (247,107.00) $ 1,086,160.00 $ 108,309.00 15 5) Current Ratio: 6 Current Ratio = Current Assets/Current Liabilities 10 0.8 09 .. 6 1.1 18 6) Acid Test or Quick Ratio: 19 Acid Test - (Current Assets - Inventories)/Current Liabilities 05 0.4 0.5 1.1 0.6 20 21 7) Cash Ratio: 22 Cash Ratio = (Cash + Cash Equivalents)/Current Liabilities 0.1 0. 1 0.1 0.6 0.2 23 24 26 27 28 29 30 31 32 33 34 35 26 > . Vertical Common Size Bal Vertical Common Size CF Liquidity Ratings Debt Ratios Profitability Ratios Investor Ratios Stock Mark Ready 1 Accessibility: Investigate Cold weather Now Q Search OIL N9 Search AutoSave On g 5 - - Hershey Financial stets FIN 425 Term Project - Saved Home Insert Page Layout Formulas Data Review View Help File Ruler Headings Hol Default Navigation Gridlines Focus Cell Zoom 100% Zoom to New Arrang Normal Page Break Page Custom H Keep New Options Window All Preview Layout Views Formula Bar Selection Zoom Sheet View Workbook Views Show 18 C D G H K L M Long-Term Debt Ratios In 2019 1) Debt Ratio: 2023 2022 2021 2020 Debt Ratio = Total Liabilities/Total Assets 65.56% 69.86% 73.52% 75.49% 78.56% 2) Times Interest Earned Ratio: TIE = Net Operating Income/Interest expense 13.29 13.51 13.26 10.87 12.04 3) Cash-based Times Interest Earned Ratio: N 10 Cash TIE = (CFO + rent payments + all interest + income tax) / (all interest) 15.31 16.92 16.35 11.38 12.24 Int 2 4) Total Capitalization Ratio: B Cap Ratio - All debt charging interest / All debt charging interest + Equity 48.04% 50.33% 59.71% 64.63% 66.92% 14 5 5) Financial Leverage Ratio (FLR): 16 FLR = Total Assets / Total Equity 2.90 3.32 3.78 4.08 4.66 17 18 19 20 21 22 23 24 25 28 31 32 33 34 35 36 -.. Vertical Common Size Bal Vertical Common Size CF Liquidity Ratios Debt Ratios Profitability Ratios Investor Ratios Stock Ready 1x Accessibility: Investigate Cold weather Now Q Search OIL NX Auto Save On 49 ~ = Hershey Financial stemts FIN 425 Term Project - Saved v Search Home Insert Page Layout Formulas Data Review View Help File Headings Default Gridlines Focus Cell Normal Page Break Page Custom Navigation Zoom 100% Zoom to New H Keep Exit New Options Preview Layout Views Formula Bar Selection Window Sheet View Workbook Views Show Zoom 118 A F G H K Profitability and Long-term Activity Ratios In 1) Gross Profit Margin: 2023 2022 2021 2020 2019 Gross Profit Margin - Gross Profit / Sales 44.8% 431.9% 45.1% 45.4% 45.4% 5 Sa 6 2) Operating Profit Margin: Gr 7 Operating Profit Margin = Net Operating Income / Sales 18.1% 17.8% 18.8% 19.9% 21.7% N 8 Ne 9 3) Net Profit Margin: To 10 Net Profit Margin = Net Income / Sales 16.7% 15.8% 16.5% 15.7% 14.4% To 11 12 4) Total Asset Turnover: 13 Total Asset TO = Sales / Total Assets 0.94 0.95 0.86 0.89 0.98 14 15 5) Return on Assets: 16 ROA = Net Profit Margin x Total Asset TO 15.6% 15.0% 14.2% 14.0% 14.1% 17 18 6) Return on Total Equity: 19 ROE - ROA & FLR 45.4% 49.8% 53.6% 57.1% 55.9% 20 21 22 23 24 35 36 Vertical Common Size Bal Vertical Common Size CF Liquidity Ratios Debt Ratios Profitability Ratios Investor Ratios Sto Ready %% Accessibility: Investigate Cold weather Now SearchHershey Financial stmts FIN 425 Term Project - Saved Search AutoSave On H - G File Home Insert Page Layout Formulas Data Review View Help Headings Q 100 Default Gridlines Focus Cell New Normal Page Break Page Custom Navigation Zoom 100% Zoom to Keep Exit New Options Formula Bar Selection Windo Preview Layout Views Zoom Sheet View Workbook Views Show A1 Investor Ratios M B H Investor Ratios 1) Price to Earnings (P/E) Ratio: 2023 2022 2021 2020 2019 P/E Ratio = Market Price per share / Earnings per share 13.12 12.61 9.34 13.1 1 8.86 2) Dividend Payout Ratio: Dividend Payout = (Dividends per share)/(earnings per share) 44.70% 44.22% 43.60% 46.81% 49.63% 3) Dividend Yield: 0 Dividend Yield = (Dividends common share)/(Market Price per share) 3.75% 3.85% 5.13% 3.93% 6.18% 22 30 31 32 33 34 35 36 Vertical Common Size Bal Vertical Common Size CF Liquidity Ratios Debt Ratios Ready Profitability Ratios 1% Accessibility: Investigate Investor Ratios Feels colder Now SearchAutoSave On Fe ? ~ ~ Hershey Financial stemts FIN 425 Term Project . Saved Search File Home Insert Page Layout Formulas Data Review View Help Default IF Ruler Headings Navigation Gridlines Focus Cell Zoom 100% Zoom to New Arrange Freeze Keep Exit New Options Normal Page Break Page Custom Preview Layout Views Formula Bar Selection Window All Panes Sheet View Workbook Views Show Zoom F28 B F G H K L M N Stock Market Performance NASDAQ ISY DJIA S&P 500 Composite Cumulative Cumulative Cumulative Cumulative Year Return (%) Return (%) Return (%) Return (%) 2019 30.5 22.3 28.9 35.2 2020 12.8 7.2 16.3 43.6 2021 24.7 18.7 26.9 21.4 2022 -3.5 -8.8 -6.2 -11.0 2023 15.2 12 5 14 8 18.3 Cumulative Return of Hershey Co Vs Major Indices 50 40 -HSY Cumulative Return (%) Cumulative Return (% DJIA Cumulative Return (96) S&P 500 Cumulative Return (9% ) -NASDAQ Composite Cumulative 10 Return (96) 20 2019 2020 2021 2022 2023 27 Year 29 30 31 32 33 34 Vertical Common Size CF Liquidity Ratios Debt Ratios Profitability Ratios Investor Ratios Stock Market Performance Ready * Accessibility: Investigate Feels colder Now Q Search 16 LAStrate Damn Hersh @ Hersh What Q chat ChatC Chats Quart Privat X help, and more (Alt + Q) Comments Merge v Percentage Ev Ry IPV QV K Industry Averages - Unweighted Average 2023 2022 DSF 2021 2020 2019 30 DSI 30 148 50 51 32 32 Current Ratio 47 40 1.3 38 Quick Ratio 1.3 1.5 0.9 1.4 0.9 Debt Ratio 1.1 1.2 0.6 1.0 0.7 0.7 92.2 0.7 0.7 89.4 6PM 226.9 41.0% 474.8 514.1 97.8% OPM 42.8% 38.1% 20.6% 21.3% 38.7% NPM 22.5% 19.9% 16.3% 21.4% 16.7% 18.2% ROA 12.2% 12.8% 10.6% 13.0% ROE 12.7% 9.4% 1.4% 10.9% 17.6% 8.5% Dividend Yield 18.5% 15.5% 3.0% 3.7% 3.8% 2.7% 3.8% Industry Averages - Weighted Average based on Sales 2023 2022 2021 2020 2019 DSR 32.2 31.9 174.8 33.8 34.5 DSI 50 51 47 39 36 Current Ratio 1.1 1.2 1.2 1.2 1.1 Quick Ratio 0.7 0.8 0.9 0.9 0.8 Debt Ratio 0.7 0.7 0.7 0.7 0.7 TIE 12.4 14.8 15.1 28.3 29.4 GPM 42.5% 59.7% 13.7% 38.6% 38.9% OPM 17.2% 18.3% 19.0% 16.8% 18.5% NPM 13.7% 14.6% 15.6% 10.0% 10.4% ROA 7.1% 9.0% 8.9% 7.0% 6.7% ROE 8.8% 22.3% 16.2% 23.7% 16.1% Dividend Yield 3.2% 2.8% 2.9% 3.0% 2.8%Home Insert Page Layout F Formulas Data Review View Help File Ruler Headings Default Gridlines Focus Cell ~ Normal Page Break Page Custom Navigation Zoom 100% H Keep Exit New Options Preview Layout Views Formula Bar Workbook Views Show Zoom Sheet View A8 VIXVAY Current assets: B G Year Ended December 31, 2023 2022 2021 2020 2019 7 ASSETS 8 Current assets: 101,902 $ 463,889 $ 329,266 S 1,143,987 $ 493,262 19 Cash and cash equivalents Accounts receivable-trade, net 823,617 711,203 671,464 615,233 568,509 1 Inventories 1,340,996 1,173,119 988,511 964,207 815,251 12 Prepaid expenses and other 345,588 272,195 256,965 254,478 240,080 13 Total current assets 2,912,103 2,620,406 2,246,206 2,977,905 2,117,102 14 15 Non current assets: 16 Property, plant and equipment, net 3,309,678 2,769,702 2,586,187 2,285,255 2,153,139 17 Goodwill 2,696,050 2,606,956 2,633,174 1,988,215 1,985,955 18 Other intangibles 1,879,229 1,966,269 2,037,588 1,295,214 1,341,166 19 Other non-current assets 1,061,427 944.989 868,203 555,887 512,000 20 Deferred income taxes 44,454 40,498 40,873 29.369 31,033 21 Total assets $ 11,902,941 $ 10,948,820 $ 10,412,231 $ 9,131,845 $ 8,140,395 22 23 LIABILITIES AND STOCKHOLDERS' EQUITY 24 Current liabilities: 25 Accounts payable 1,086,183 970,558 692,338 580,058 550.828 26 Accrued liabilities 867,815 832,518 855,638 781,766 702,372 27 Accrued income taxes 29,457 6,710 3,070 17,051 19,921 28 Short-term debt 719,839 693,790 939,423 74,041 32,282 29 Current portion of long-term debt 305,058 753,578 2,844 438,829 703,390 Total current liabilities 3,008,352 3,257,154 2,493,313 1,891, 745 2,008, 793 Long-term debt 3,789,132 3,343,977 4,086,627 4,089,755 3,530,813 33 Other long-term liabilities 660,673 719,742 787,058 683,434 655,777 Deferred income taxes 345,698 328,403 288,004 229,028 200,018 35 Total liabilities 7,803,855 7,649,276 7,655,002 6,893.962 6,395,401 36 37 Stockholders' equity: 38 The Hershey Company stockholders equity Common stock, shares issued: 166,939,511 in 2023 39 and 163,439,248 in 2022 166,939 163,439 160,939 160,939 160,939 Class B common stock, shares issued: 54,613,514 in 40 2023 and 58,113,777 in 2022 54,614 58,114 60.61 60.614 41 Additional paid-in capital 60,614 ,345,580 1,296,572 1,260,331 1,191,200 1,142,210 42 Retained earnings 4,562,263 3,589,781 2,719,936 Treasury-common stock shares, at 1,928,673 1,290,461 43 cost: 17,160.099 in 2023 and 16.588 308 in 2022 (1,800,232) (1,556,029) 44 Accumulated other comprehensive loss (1,195,376) 768,992) (591,036) (230,078) (252,333) 45 Total stockholders equity (249,215) (338,082) (323,966) 4,099,086 3,299 544 2.757 229 46 Total liabilities and stockholders equity 2,237,883 1,744,994 47 $ 11,902,941 $ 10,948.820 $ 10,412,231 $ 9,131,845 $ 8,140,395 Income Statement Balance Sheet Cash Flow Horizontal Common Size Inc Stemt Horizontal Common Size Bal Ready Accessibility: Investigate 2 in. of snow Wednesday SearchFormulas Data Review File Home Insert Page Layout View Help Ruler Headings Default Page Break Page Custom Navigation Gridlines Focus Cell ~ Normal Zoom 1009 H Keep Exit
Step by Step Solution
There are 3 Steps involved in it
1 Expert Approved Answer
Step: 1 Unlock
Question Has Been Solved by an Expert!
Get step-by-step solutions from verified subject matter experts
Step: 2 Unlock
Step: 3 Unlock
Students Have Also Explored These Related Finance Questions!