

Question: Include the overall probability analysis for all companies (1,2,3,4). In the last sentence of the paragraph identify which company is better from the perspective of
Include the overall probability analysis for all companies (1,2,3,4). In the last sentence of the paragraph identify which company is better from the perspective of profitability.
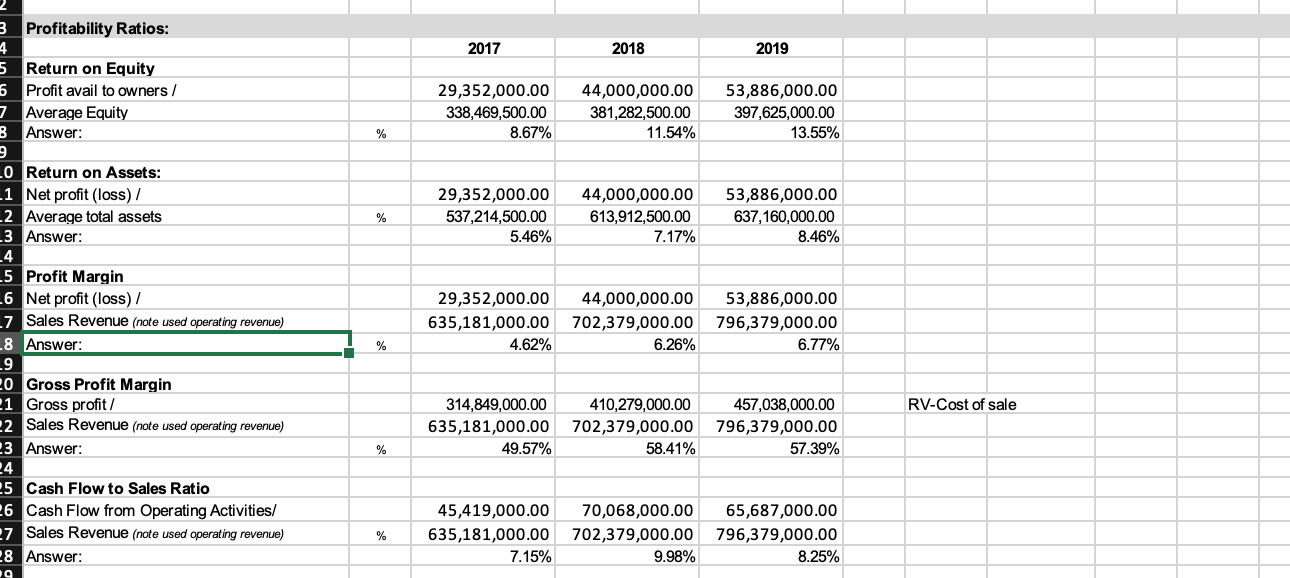
Company 1
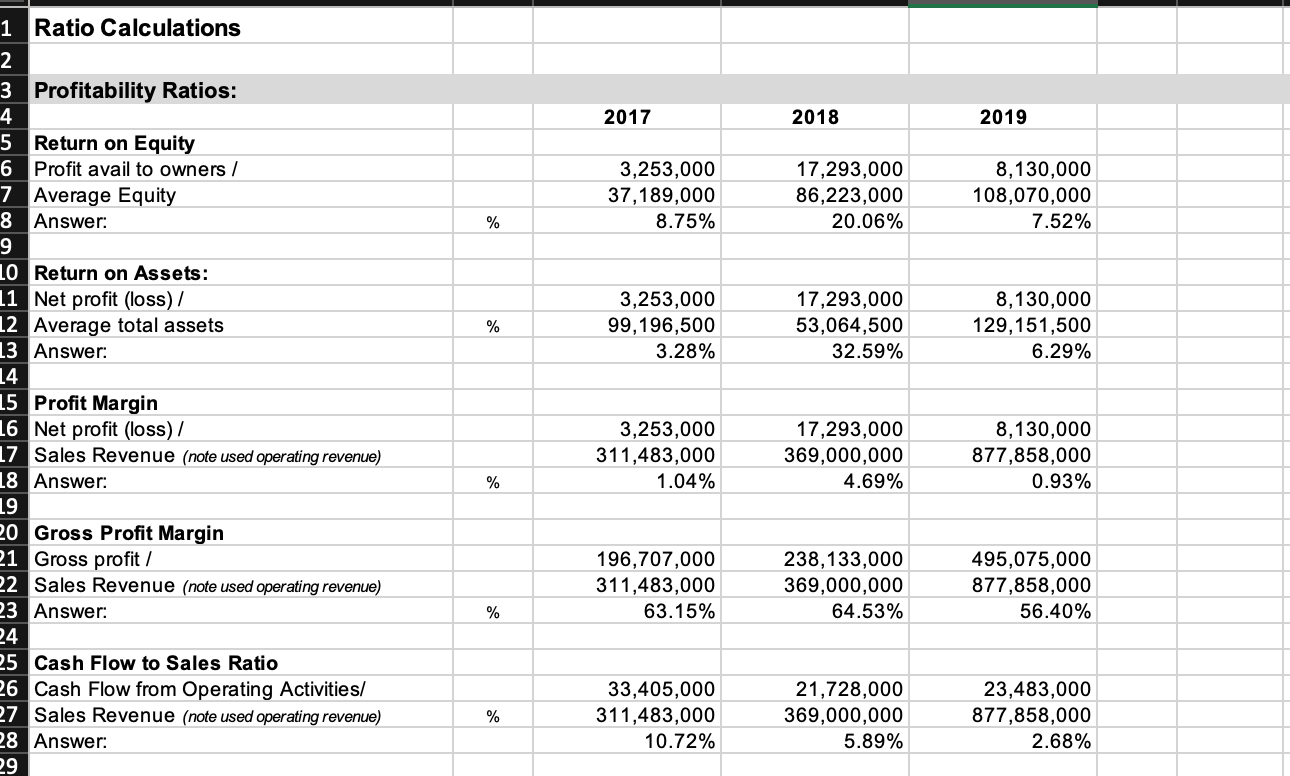
Company 2
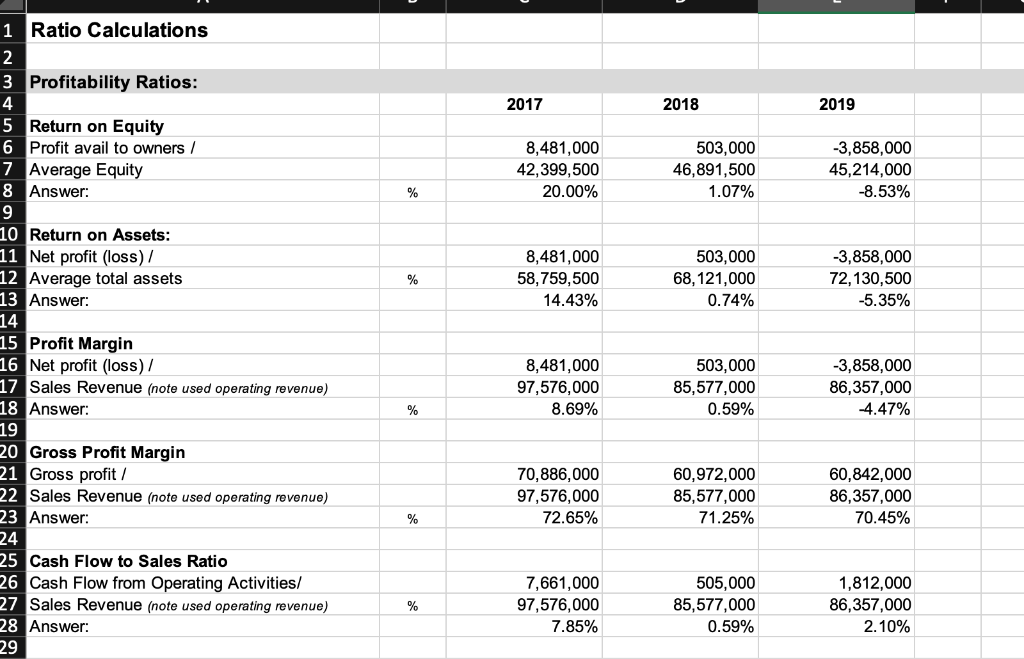
Company 3
Company 4
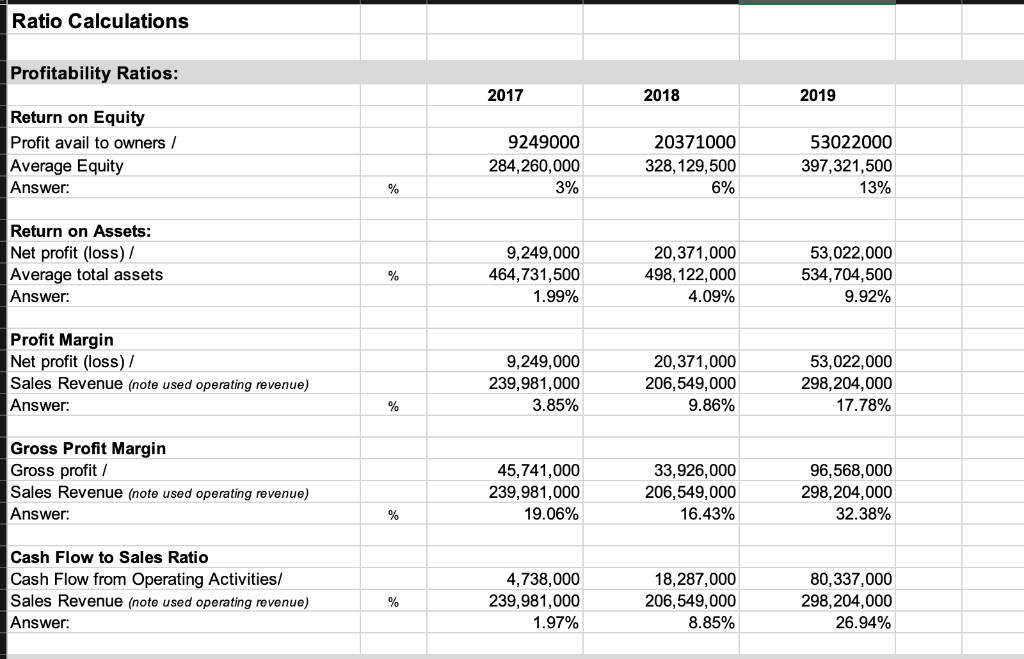
2017 2018 2019 3 Profitability Ratios: 4 5 Return on Equity 6 Profit avail to owners/ 7 Average Equity B Answer: 29,352,000.00 338,469,500.00 8.67% 44,000,000.00 381,282,500.00 11.54% 53,886,000.00 397,625,000.00 13.55% % % 29,352,000.00 537,214,500.00 5.46% 44,000,000.00 613,912,500.00 7.17% 53,886,000.00 637,160,000.00 8.46% 29,352,000.00 635,181,000.00 4.62% 44,000,000.00 702,379,000.00 6.26% 53,886,000.00 796,379,000.00 6.77% % .0 Return on Assets: -1 Net profit (loss) / .2 Average total assets 23 Answer: 4 5 Profit Margin -6 Net profit (loss) / -7 Sales Revenue (note used operating revenue) -8 Answer: 9 20 Gross Profit Margin 21 Gross profit/ 22 Sales Revenue (note used operating revenue) 23 Answer: 24 5 Cash Flow to Sales Ratio 6 Cash Flow from Operating Activities/ 27 Sales Revenue (note used operating revenue) 28 Answer: 19 RV-Cost of sale 314,849,000.00 410,279,000.00 635,181,000.00 702,379,000.00 49.57% 58.41% 457,038,000.00 796,379,000.00 57.39% % % 45,419,000.00 70,068,000.00 65,687,000.00 635,181,000.00 702,379,000.00 796,379,000.00 7.15% 9.98% 8.25% 2017 2018 2019 3,253,000 37,189,000 8.75% 17,293,000 86,223,000 20.06% 8,130,000 108,070,000 7.52% % % 3,253,000 99,196,500 3.28% 17,293,000 53,064,500 32.59% 8,130,000 129,151,500 6.29% 1 Ratio Calculations 2 3 Profitability Ratios: 4 5 Return on Equity 6 Profit avail to owners/ 7 Average Equity 8 Answer: 9 LO Return on Assets: 11 Net profit (loss) / 12 Average total assets 13 Answer: 14 15 Profit Margin 16 Net profit (loss) / 17 Sales Revenue (note used operating revenue) 18 Answer: 19 20 Gross Profit Margin 21 Gross profit / 22 Sales Revenue (note used operating revenue) 23 Answer: 24 25 Cash Flow to Sales Ratio 26 Cash Flow from Operating Activities/ 27 Sales Revenue (note used operating revenue) 28 Answer: 29 3,253,000 311,483,000 1.04% 17,293,000 369,000,000 4.69% 8,130,000 877,858,000 0.93% % 196,707,000 311,483,000 63.15% 238,133,000 369,000,000 64.53% 495,075,000 877,858,000 56.40% % % 33,405,000 311,483,000 10.72% 21,728,000 369,000,000 5.89% 23,483,000 877,858,000 2.68% 2017 2018 2019 8,481,000 42,399,500 20.00% 503,000 46,891,500 1.07% -3,858,000 45,214,000 -8.53% % % 8,481,000 58,759,500 14.43% 503,000 68,121,000 0.74% -3,858,000 72,130,500 -5.35% 1 Ratio Calculations 2 3 Profitability Ratios: 4 5 Return on Equity 6 Profit avail to owners/ 7 Average Equity 8 Answer: 9 10 Return on Assets: 11 Net profit (loss) / 12 Average total assets 13 Answer: 14 15 Profit Margin 16 Net profit (loss) / 17 Sales Revenue (note used operating revenue) 18 Answer: 19 20 Gross Profit Margin 21 Gross profit / 22 Sales Revenue (note used operating revenue) 23 Answer: 24 25 Cash Flow to Sales Ratio 26 Cash Flow from Operating Activities/ 27 Sales Revenue (note used operating revenue) 28 Answer: 29 8,481,000 97,576,000 8.69% 503,000 85,577,000 0.59% -3,858,000 86,357,000 -4.47% % 70,886,000 97,576,000 72.65% 60,972,000 85,577,000 71.25% 60,842,000 86,357,000 70.45% % % 7,661,000 97,576,000 7.85% 505,000 85,577,000 0.59% 1,812,000 86,357,000 2.10% Ratio Calculations Profitability Ratios: 2017 2018 2019 Return on Equity Profit avail to owners/ Average Equity Answer: 9249000 284,260,000 3% 20371000 328, 129,500 6% 53022000 397,321,500 13% % Return on Assets: Net profit (loss) / Average total assets Answer: % 9,249,000 464,731,500 1.99% 20,371,000 498, 122,000 4.09% 53,022,000 534,704,500 9.92% Profit Margin Net profit (loss) / Sales Revenue (note used operating revenue) Answer: 9,249,000 239,981,000 3.85% 20,371,000 206,549,000 9.86% 53,022,000 298,204,000 17.78% % Gross Profit Margin Gross profit / Sales Revenue (note used operating revenue) Answer: 45,741,000 239,981,000 19.06% 33,926,000 206,549,000 16.43% 96,568,000 298,204,000 32.38% % Cash Flow to Sales Ratio Cash Flow from Operating Activities/ Sales Revenue (note used operating revenue) Answer: % 4,738,000 239,981,000 1.97% 18,287,000 206,549,000 8.85% 80,337,000 298, 204,000 26.94%
Step by Step Solution
There are 3 Steps involved in it

Get step-by-step solutions from verified subject matter experts