

Question: (include your Tableau url in word file with discussion) You have been hired by Giant to assist them in developing a digital dashboard (DD). They
(include your Tableau url in word file with discussion)
You have been hired by Giant to assist them in developing a digital dashboard (DD). They want to keep track of following items:
- BPM (business performance measurement)
- Gantt chart for the project they are developing
- Profit by product categories by customer for each quarter and month by state
- Draw a graphical chart which shows size of total sales by state by tea
GIANT sales file is available with the assignment
You are to develop a digital dashboard (DD) using Tableau software. Divide the DD in four parts and put one part of requirement (see below) in one part of the DD. (see the following DD)
| Part A | Part B |
| Part C | Part D |
Make sure to put your name (on the title) on all worksheet and digital dashboard
Part A (BPM)
Create a Profit KPI that keep track of total Profits
Profit for each product should be defined as follows:
Total profit outcome
Between 0 and
Between 5000 and
>=8000 Excellent (Green color)
Your first worksheet should look at follows (note you may not get exactly the same picture, (your data maybe different)
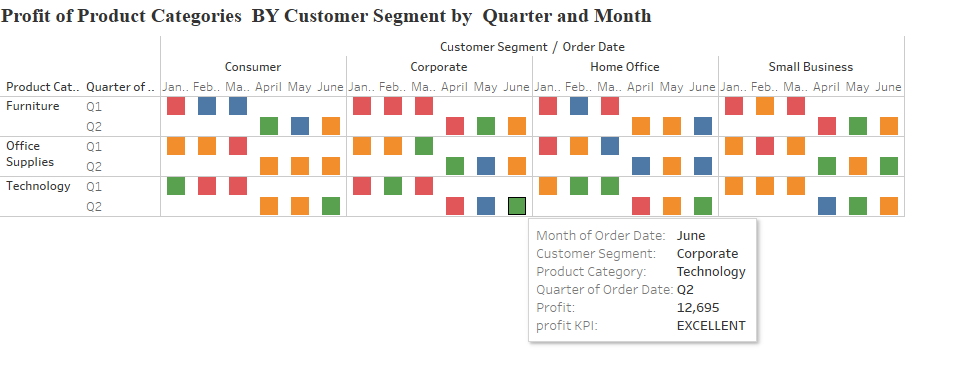
Heading should be in Times new Roman font 15 Bold
Save it as Product type by customer and quarter title
Part B (Gantt Chart)
The Giant Company is planning to build a distribution warehouse and would like to develop a Gantt chart. Using following data, develop a Gantt chart in Tableau.
Create the following file in EXCEL and then develop a Gantt chart in Tableau
| Task | Start date | Duration |
| Plan | 2/15/2023 | 8 |
| Select site | 3/20/2023 | 12 |
| Draw conceptual plan | 4/30/2023 | 15 |
| Buy Material | 6/15/2023 | 6 |
| Start basement | 8/5/2023 | 25 |
| Start other parts | 11/12/2023 | 25 |
| Inspect | 11/28/2023 | 5 |
Draw a reference line and discus how much project is finished based on reference line. Following would be useful
- https://www.youtube.com/watch?v=22H4ttDVl5c
Call this worksheet warehouse
Develop a KPI that keeps track of completed, in progress and future tasks and show it on your worksheet using appropriate color.
Part C:
In the third worksheet, draw a line graph for total sales for each quarter and for each product Category by state (only for three states, California, Washington and Oregon). Call this worksheet sales by quarter by state
Part D:
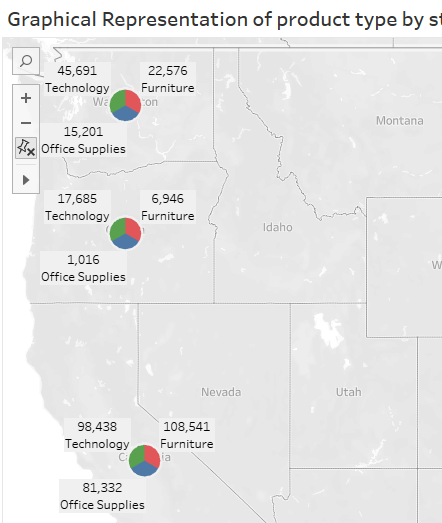
Draw a geographical chart which shows total quantity by state (only for three state California, Washington and Oregon) by product Category. Use a pie chart to show product type. Your worksheet should look like: (your numbers maybe different)
Save it as graphical representation
PART E:
Sections:
- Create a dashboard with all four worksheet (name it appropriately and make it attractive)
- Draw state filter on dash board that can work on worksheets that contain states
To be submitted:
- Submit the url of your assignment in Sakai AND INCLUDE word FILE ALSO with part 1 and 2 discussions
Part F: (WORD file)
SECTIONS:
- Management report (in WORD) describing the state of the Giant company using four parts. Explain how the digital dashboard can help the management in improving their performance.
- How will this help the tea company CEO if this was a real time dashboard?
- Part G: (Tableau file)
Submit the url or the tableau file in SAKAI
Grading Rubric:
| PARTS | POINTS | Your points | |
| A | 10 | ||
| B | 10 | ||
| C | 10 | ||
| D | 10 | ||
| E | |||
| Section 1 (create DD) | 3 | ||
| Section 2 (create filter) | 3 | ||
| F | |||
| Section 1 | 3 | ||
| Section 2 | 1 | ||
| total | 50 |
rofit of Product Categories BY Customer Segment by Quarter and Month Granhical Renresentation of nroduct tvne hv s rofit of Product Categories BY Customer Segment by Quarter and Month Granhical Renresentation of nroduct tvne hv s
Step by Step Solution
There are 3 Steps involved in it

Get step-by-step solutions from verified subject matter experts