

Question: included are additional information as requested. worse case best case most likely case 1 Northeast Hospital is analyzing a potential project for a new outpatient
included are additional information as requested.
worse case
best case
most likely case
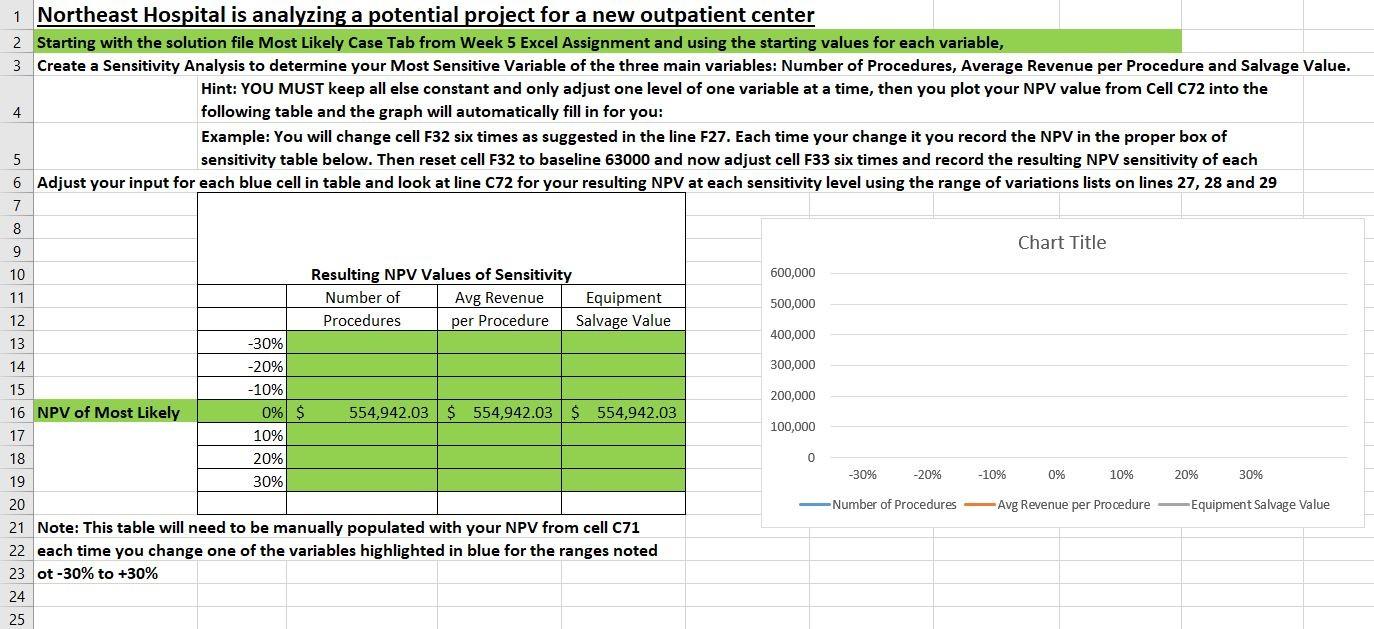
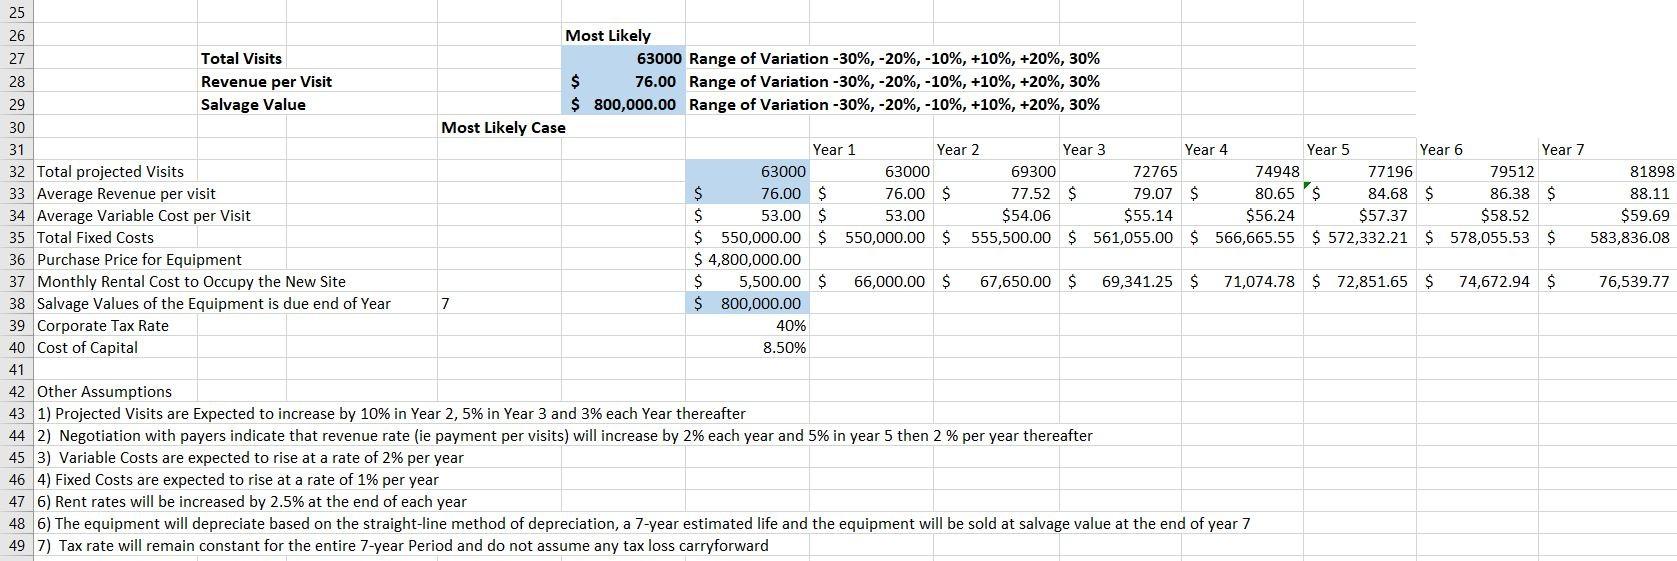
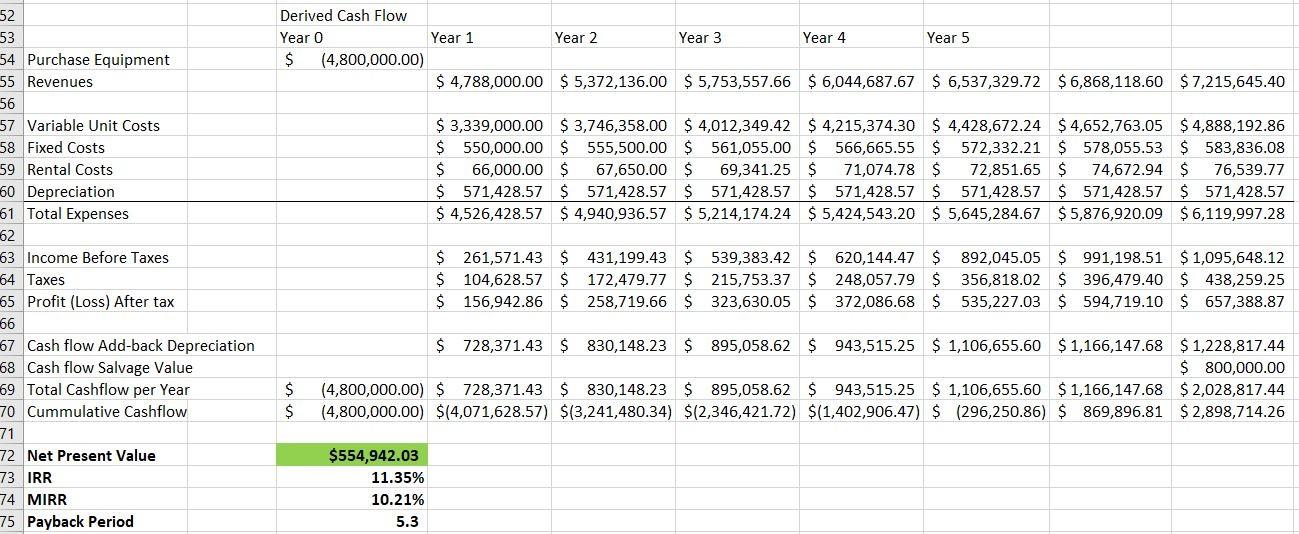
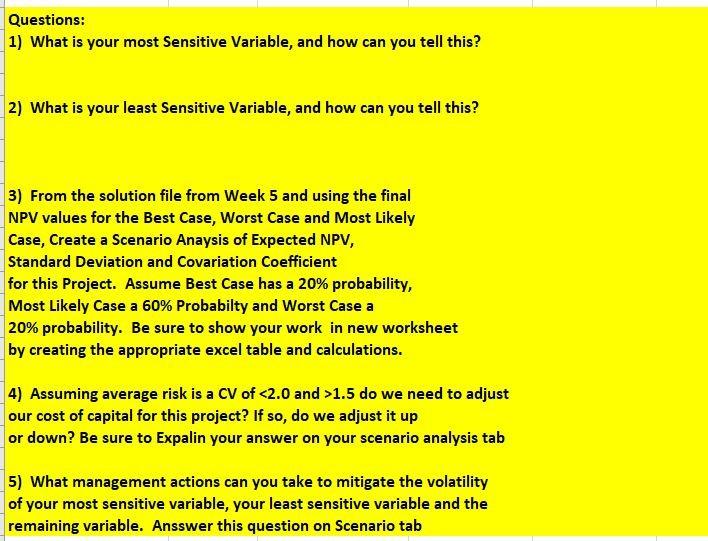
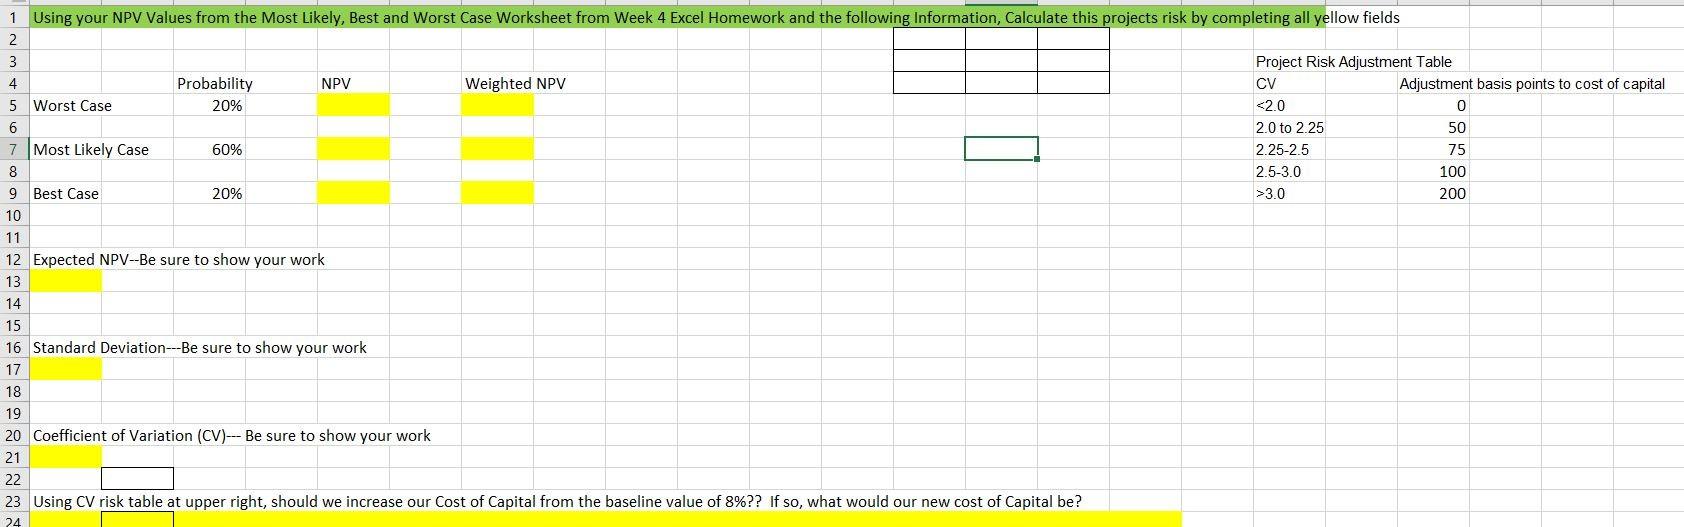
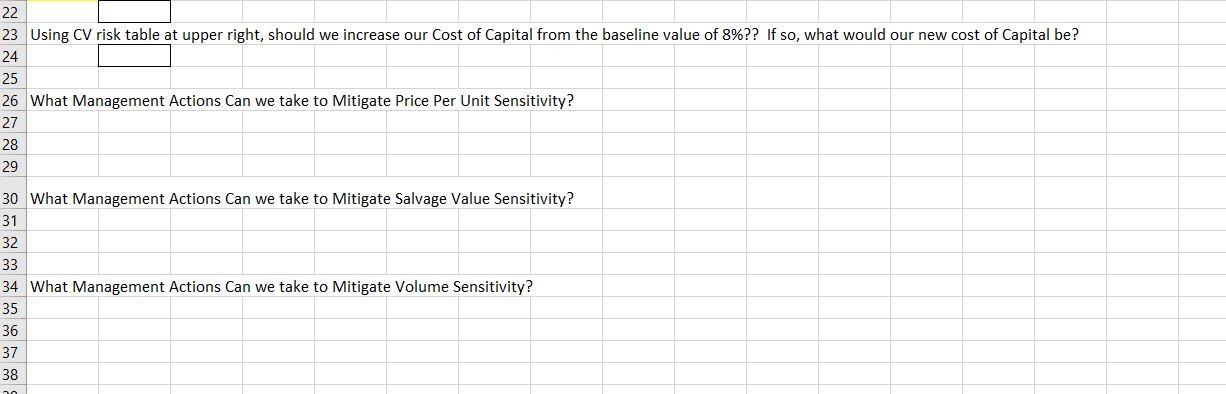
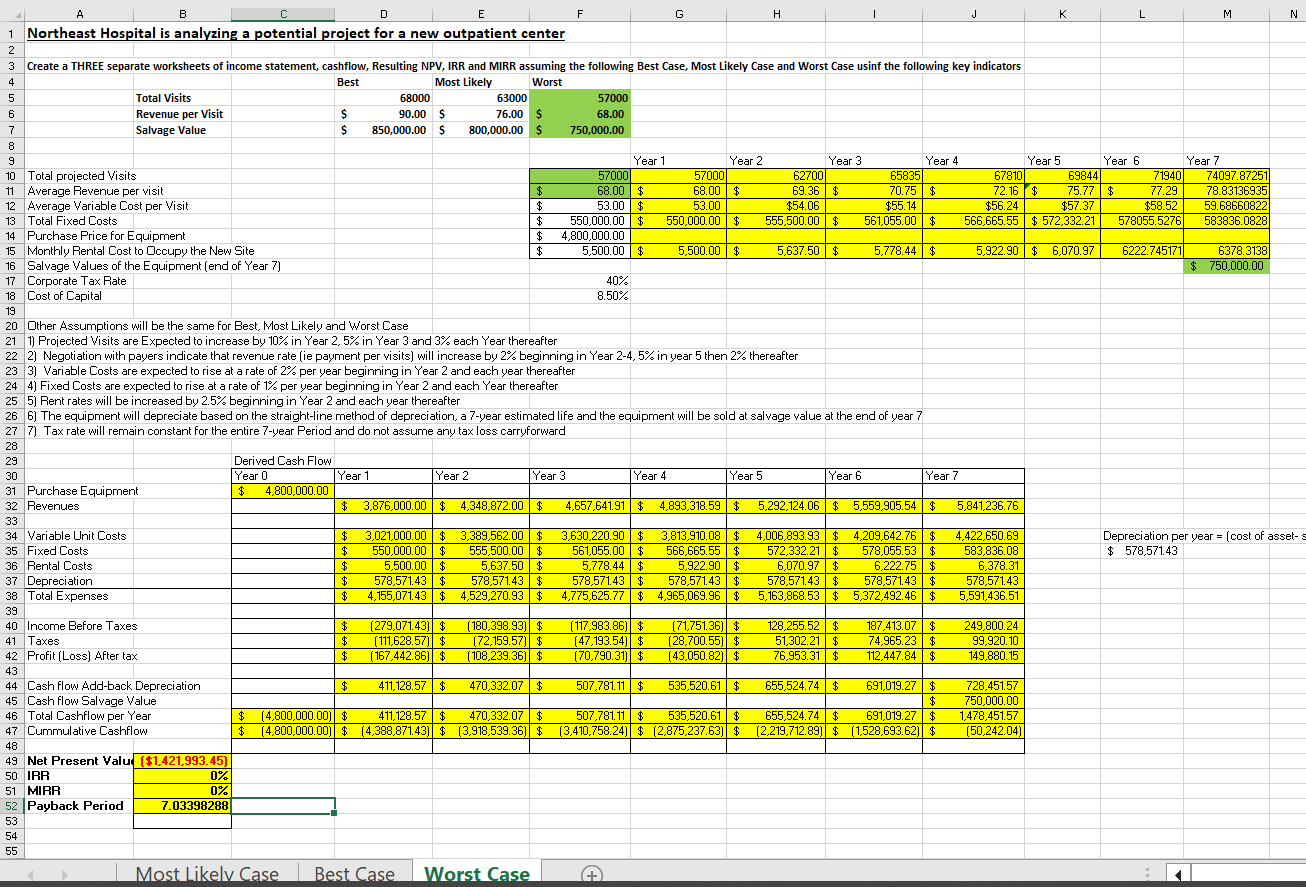
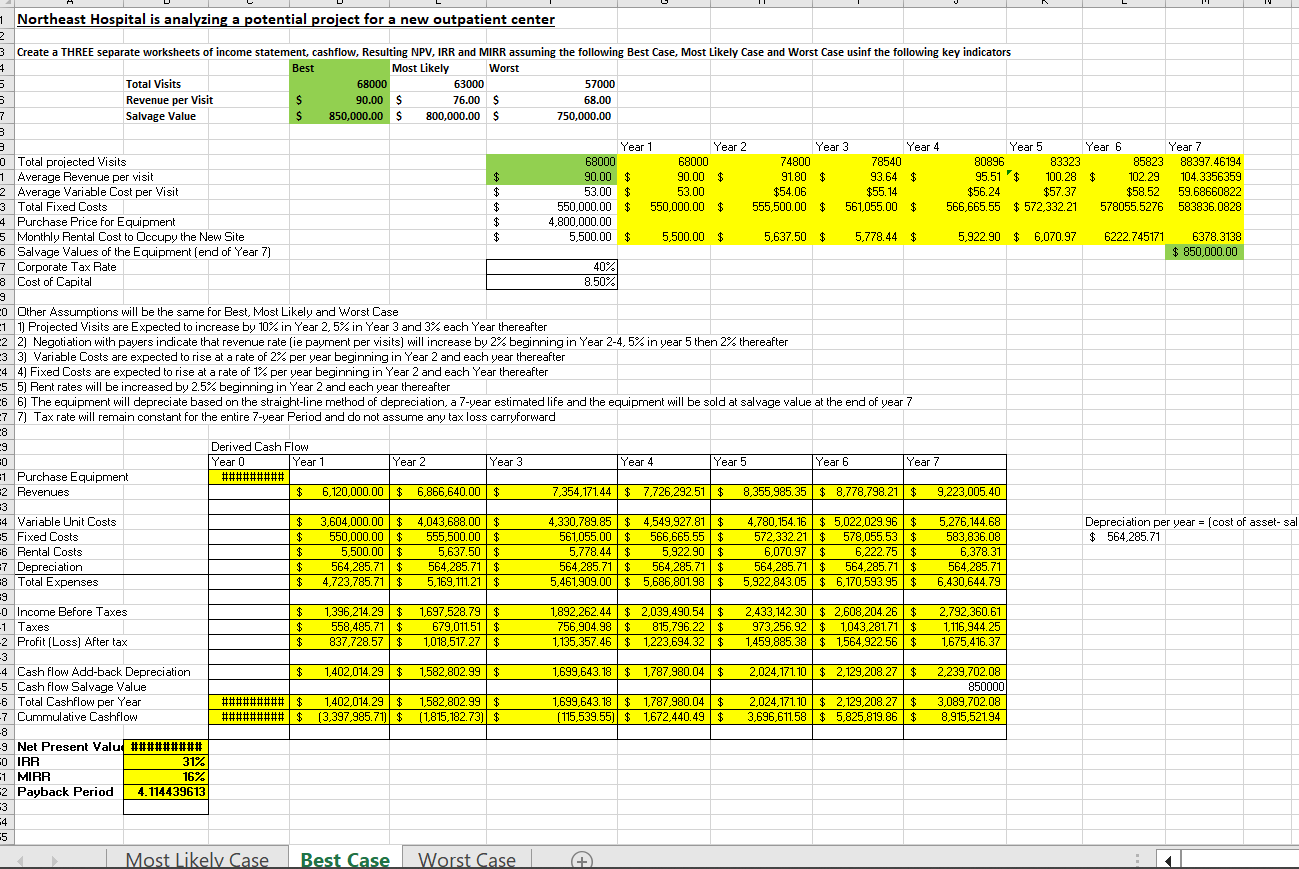
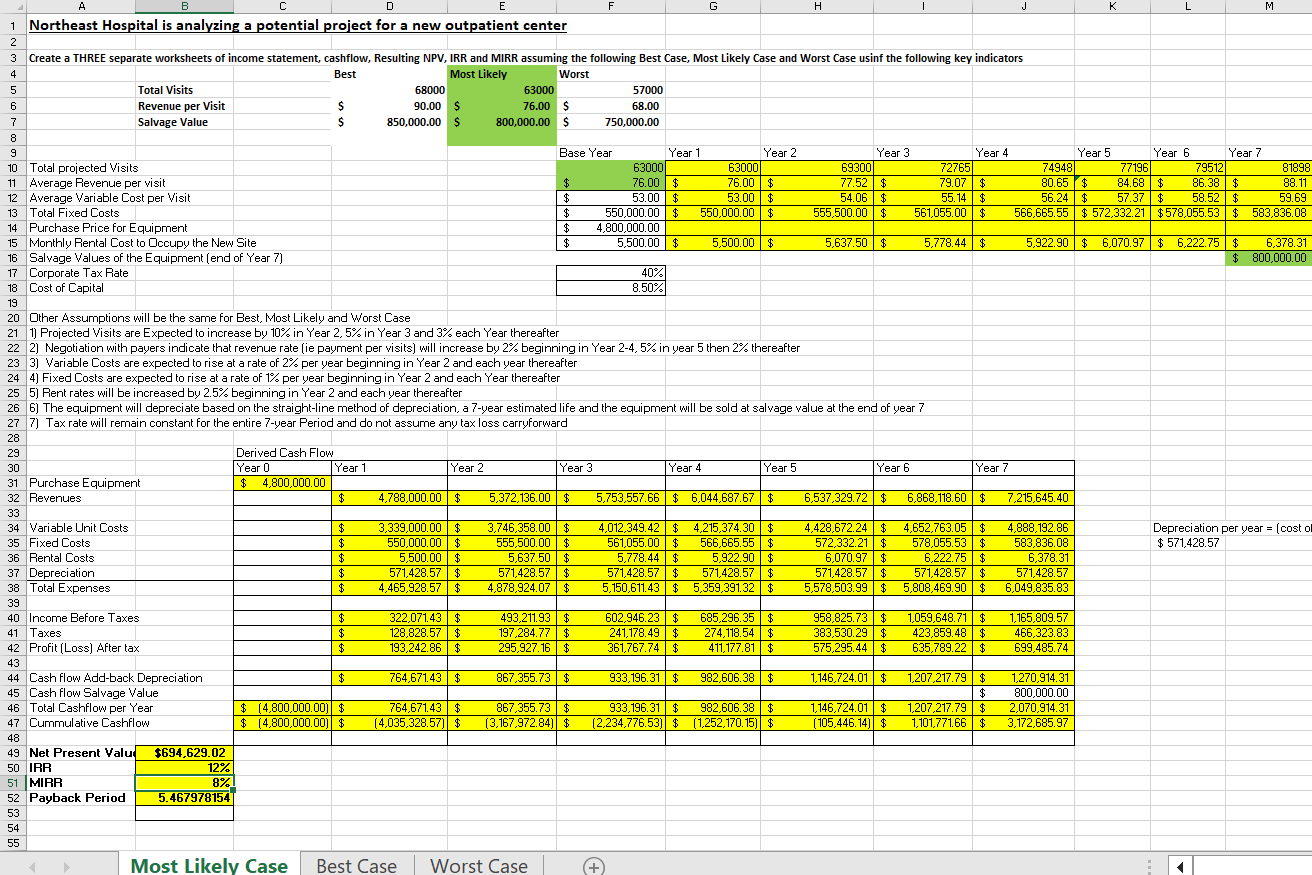
1 Northeast Hospital is analyzing a potential project for a new outpatient center 2 Starting with the solution file Most Likely Case Tab from Week 5 Excel Assignment and using the starting values for each variable, 3 Create a Sensitivity Analysis to determine your Most Sensitive Variable of the three main variables: Number of Procedures, Average Revenue per Procedure and Salvage Value. Hint: YOU MUST keep all else constant and only adjust one level of one variable at a time, then you plot your NPV value from Cell C72 into the following table and the graph will automatically fill in for you: Example: You will change cell F32 six times as suggested in the line F27. Each time your change it you record the NPV in the proper box of sensitivity table below. Then reset cell F32 to baseline 63000 and now adjust cell F33 six times and record the resulting NPV sensitivity of each Adjust your input for each blue cell in table and look at line C2 for your resulting NPV at each sensitivity level using the range of variations lists on lines 27,28 and 29 21 Note: This table will need to be manually populated with your NPV from cell C71 22 each time you change one of the variables highlighted in blue for the ranges noted 23 ot 30% to +30% Other Assumptions 1) Projected Visits are Expected to increase by 10% in Year 2, 5\% in Year 3 and 3% each Year thereafter 2) Negotiation with payers indicate that revenue rate (ie payment per visits) will increase by 2% each year and 5% in year 5 then 2% per year thereafter 3) Variable Costs are expected to rise at a rate of 2% per year 4) Fixed Costs are expected to rise at a rate of 1% per year 6) Rent rates will be increased by 2.5% at the end of each year 6) The equipment will depreciate based on the straight-line method of depreciation, a 7 -year estimated life and the equipment will be sold at salvage value at the end of year 7 7) Tax rate will remain constant for the entire 7-year Period and do not assume any tax loss carryforward Questions: 1) What is your most Sensitive Variable, and how can you tell this? 2) What is your least Sensitive Variable, and how can you tell this? 3) From the solution file from Week 5 and using the final NPV values for the Best Case, Worst Case and Most Likely Case, Create a Scenario Anaysis of Expected NPV, Standard Deviation and Covariation Coefficient for this Project. Assume Best Case has a 20\% probability, Most Likely Case a 60% Probabilty and Worst Case a 20% probability. Be sure to show your work in new worksheet by creating the appropriate excel table and calculations. 4) Assuming average risk is a CV of 1.5 do we need to adjust our cost of capital for this project? If so, do we adjust it up or down? Be sure to Expalin your answer on your scenario analysis tab 5) What management actions can you take to mitigate the volatility of your most sensitive variable, your least sensitive variable and the remaining variable. Ansswer this question on Scenario tab Expected NPV--Be sure to show your work Standard Deviation---Be sure to show your work Coefficient of Variation (CV)-- Be sure to show your work Using CV risk table at upper right, should we increase our Cost of Capital from the baseline value of 8% ?? If so, what would our new cost of Capital be? 23 Using CV risk table at upper right, should we increase our Cost of Capital from the baseline value of 8% ?? If so, what would our new cost of Capital be? What Management Actions Can we take to Mitigate Price Per Unit Sensitivity? What Management Actions Can we take to Mitigate Salvage Value Sensitivity? What Management Actions Can we take to Mitigate Volume Sensitivity? Northeast Hospital is analyzing a potential project for a new outpatient center Dther Assumptions will be the same for Best, Most Likely and Worst Case 1) Projected Visits are Expected to increase by 10% in Year 2,5% in Year 3 and 3% each Year thereafter 2] Negotiation with payers indicate that revenue rate [ie payment per visits] will increase by 2% beginning in Year 24,5% in year 5 then 2% thereafter 3) Variable Costs are expected to rise at a rate of 2% per year beginning in Year 2 and each year thereafter 4] Fixed Costs are expected to rise at a rate of 1% per year beginning in Year 2 and each Year thereafter 5) Rent rates will be increased by 2.5% beginning in Year 2 and each year thereafter 7) Tax rate will remain constant for the entire 7-year Period and do not assume any tax loss carryforward Derived Cash Flow Purchase Equipment Reverues Variable Unit Costs Depreciation per year = (cost of asset- sal Fixed Costs $564,285.71 Rental Costs Depreciation Total Expernes Income Before Taxes Taxes 2 Profit [Loss] After tax 4 Cash flow Add-back Depreciation 5 Cash flow Salvage Value 6 Total Cashflow per Year 7 Cummulative Cashflow Northeast Hospital is analyzing a potential project for a new outpatient center Dther Assumptions will be the same for Best, Most Likely and Worst Case 1 1) Projected Visits are Expected to increase by 10% in Year 2,5% in Year 3 and 3% each Year thereafter 2 2) Negotiation with payers indicate that revenue rate (ie payment per visits] will increase by 2% beginning in Year 24,5% in year 5 then 2% thereafter 3) Variable Costs are expected to rise at a rate of 2% per year beginning in Year 2 and each year thereafter 4] Fixed Costs are expected to rise at a rate of 1% per year beginning in Year 2 and each Year thereafter 5) Rent rates will be increased by 2.5% beginning in Year 2 and each year thereafter 7) Tax rate will remain constant for the entire 7-vear Period and do not assume any tax loss carryforward 1 Northeast Hospital is analyzing a potential project for a new outpatient center 2 Starting with the solution file Most Likely Case Tab from Week 5 Excel Assignment and using the starting values for each variable, 3 Create a Sensitivity Analysis to determine your Most Sensitive Variable of the three main variables: Number of Procedures, Average Revenue per Procedure and Salvage Value. Hint: YOU MUST keep all else constant and only adjust one level of one variable at a time, then you plot your NPV value from Cell C72 into the following table and the graph will automatically fill in for you: Example: You will change cell F32 six times as suggested in the line F27. Each time your change it you record the NPV in the proper box of sensitivity table below. Then reset cell F32 to baseline 63000 and now adjust cell F33 six times and record the resulting NPV sensitivity of each Adjust your input for each blue cell in table and look at line C2 for your resulting NPV at each sensitivity level using the range of variations lists on lines 27,28 and 29 21 Note: This table will need to be manually populated with your NPV from cell C71 22 each time you change one of the variables highlighted in blue for the ranges noted 23 ot 30% to +30% Other Assumptions 1) Projected Visits are Expected to increase by 10% in Year 2, 5\% in Year 3 and 3% each Year thereafter 2) Negotiation with payers indicate that revenue rate (ie payment per visits) will increase by 2% each year and 5% in year 5 then 2% per year thereafter 3) Variable Costs are expected to rise at a rate of 2% per year 4) Fixed Costs are expected to rise at a rate of 1% per year 6) Rent rates will be increased by 2.5% at the end of each year 6) The equipment will depreciate based on the straight-line method of depreciation, a 7 -year estimated life and the equipment will be sold at salvage value at the end of year 7 7) Tax rate will remain constant for the entire 7-year Period and do not assume any tax loss carryforward Questions: 1) What is your most Sensitive Variable, and how can you tell this? 2) What is your least Sensitive Variable, and how can you tell this? 3) From the solution file from Week 5 and using the final NPV values for the Best Case, Worst Case and Most Likely Case, Create a Scenario Anaysis of Expected NPV, Standard Deviation and Covariation Coefficient for this Project. Assume Best Case has a 20\% probability, Most Likely Case a 60% Probabilty and Worst Case a 20% probability. Be sure to show your work in new worksheet by creating the appropriate excel table and calculations. 4) Assuming average risk is a CV of 1.5 do we need to adjust our cost of capital for this project? If so, do we adjust it up or down? Be sure to Expalin your answer on your scenario analysis tab 5) What management actions can you take to mitigate the volatility of your most sensitive variable, your least sensitive variable and the remaining variable. Ansswer this question on Scenario tab Expected NPV--Be sure to show your work Standard Deviation---Be sure to show your work Coefficient of Variation (CV)-- Be sure to show your work Using CV risk table at upper right, should we increase our Cost of Capital from the baseline value of 8% ?? If so, what would our new cost of Capital be? 23 Using CV risk table at upper right, should we increase our Cost of Capital from the baseline value of 8% ?? If so, what would our new cost of Capital be? What Management Actions Can we take to Mitigate Price Per Unit Sensitivity? What Management Actions Can we take to Mitigate Salvage Value Sensitivity? What Management Actions Can we take to Mitigate Volume Sensitivity? Northeast Hospital is analyzing a potential project for a new outpatient center Dther Assumptions will be the same for Best, Most Likely and Worst Case 1) Projected Visits are Expected to increase by 10% in Year 2,5% in Year 3 and 3% each Year thereafter 2] Negotiation with payers indicate that revenue rate [ie payment per visits] will increase by 2% beginning in Year 24,5% in year 5 then 2% thereafter 3) Variable Costs are expected to rise at a rate of 2% per year beginning in Year 2 and each year thereafter 4] Fixed Costs are expected to rise at a rate of 1% per year beginning in Year 2 and each Year thereafter 5) Rent rates will be increased by 2.5% beginning in Year 2 and each year thereafter 7) Tax rate will remain constant for the entire 7-year Period and do not assume any tax loss carryforward Derived Cash Flow Purchase Equipment Reverues Variable Unit Costs Depreciation per year = (cost of asset- sal Fixed Costs $564,285.71 Rental Costs Depreciation Total Expernes Income Before Taxes Taxes 2 Profit [Loss] After tax 4 Cash flow Add-back Depreciation 5 Cash flow Salvage Value 6 Total Cashflow per Year 7 Cummulative Cashflow Northeast Hospital is analyzing a potential project for a new outpatient center Dther Assumptions will be the same for Best, Most Likely and Worst Case 1 1) Projected Visits are Expected to increase by 10% in Year 2,5% in Year 3 and 3% each Year thereafter 2 2) Negotiation with payers indicate that revenue rate (ie payment per visits] will increase by 2% beginning in Year 24,5% in year 5 then 2% thereafter 3) Variable Costs are expected to rise at a rate of 2% per year beginning in Year 2 and each year thereafter 4] Fixed Costs are expected to rise at a rate of 1% per year beginning in Year 2 and each Year thereafter 5) Rent rates will be increased by 2.5% beginning in Year 2 and each year thereafter 7) Tax rate will remain constant for the entire 7-vear Period and do not assume any tax loss carryforward
Step by Step Solution
There are 3 Steps involved in it

Get step-by-step solutions from verified subject matter experts