

Question: Income lance sheets data for Virtual Gaming Systems are provided below. VIRTUAL GAMING SYSTEMS Income Statements For the years ended December 31 2022 202 Net
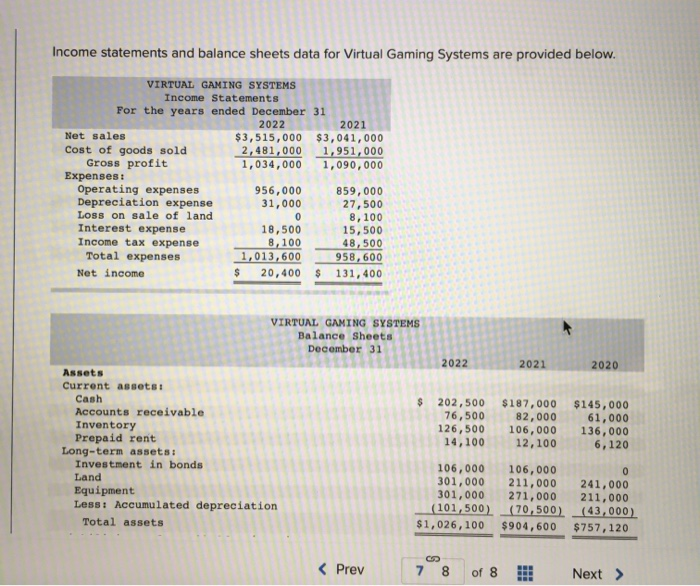
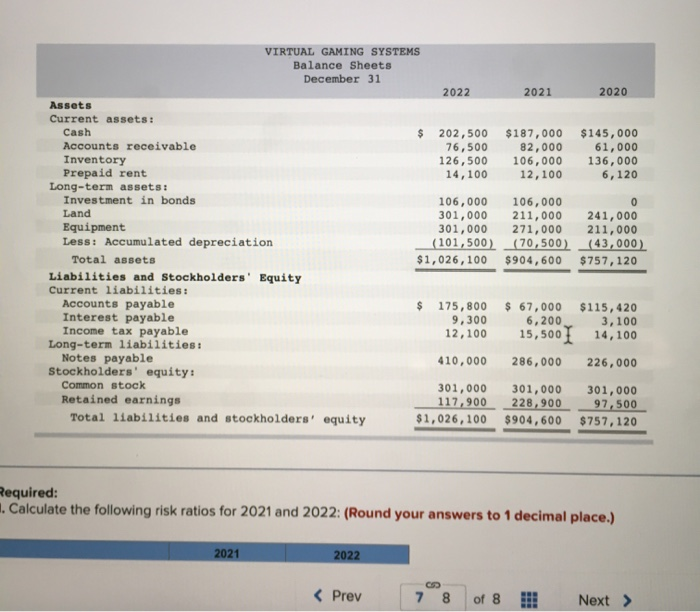
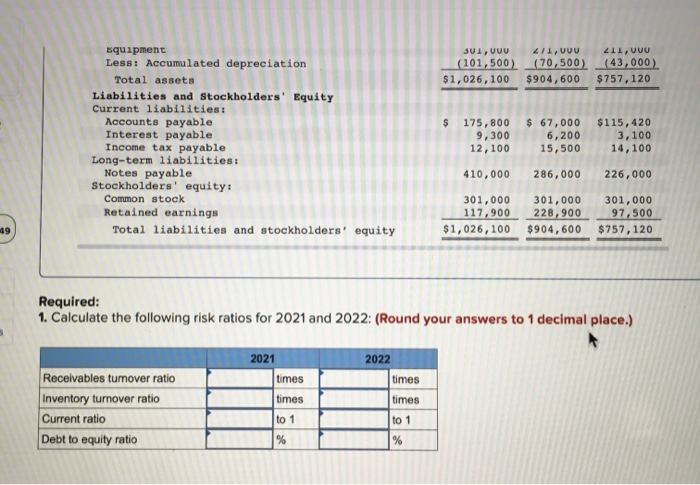
Income lance sheets data for Virtual Gaming Systems are provided below. VIRTUAL GAMING SYSTEMS Income Statements For the years ended December 31 2022 202 Net sales $3,515,000 $3,041,000 Cost of goods sold 2,481,000 1,951,000 Gross profit 1,034,000 1,090,000 Expenses: Operating expenses 956,000 859,000 Depreciation expense 31,000 27,500 Loss on sale of land 0 8 , 100 Interest expense 18,500 15,500 Income tax expense 8,100 48,500 Total expenses 1,013,600 958,600 Net income 20,400 $ 131,400 VIRTUAL GAMING SYS Balance Sheets December 31 022 2020 Assets Current assets: Cash Accounts receivabl Inventory Prepaid rent Long-term assets: Investment in bonds Land Equipment Less: Accumulated deprec Total assets 202,500 76,500 126,500 14,100 $187,000 82,000 106,000 12,100 $145,000 61,000 136,000 6,120 241,000 106,000 301,000 301,000 (101,500). $1,026,100 106,000 211,000 271,000 (70,500). $904,600 (43,000) $ 757, 120 VIRTUAL GAMING SYSTEMS Balance Sheets December 31 2022 2021 2020 $ 202,500 76,500 126,500 14,100 $187,000 82,000 106,000 12,100 $145,000 61,000 136,000 6, 120 Assets Current assets: Cash Accounts receivable Inventory Prepaid rent Long-term assets: Investment in bonds Land Equipment Less: Accumulated depreciation Total assets Liabilities and Stockholders' Equity Current liabilities: Accounts payable Interest payable Income tax payable Long-term liabilities: Notes payable Stockholders' equity: Common stock Retained earnings Total liabilities and stockholders' equity 106,000 301,000 301,000 (101,500) $1,026,100 106,000 211,000 271,000 (70, 500) $904,600 241,000 211,000 (43,000) $757, 120 $ 175,800 9,300 12,100 $ 67,000 6,200 15,500 1 $115, 420 3,100 14,100 410,000 286,000 226,000 301,000 117,900 $1,026,100 301,000 228,900 $904,600 301,000 9 7,500 $757, 120 Required: 1. Calculate the following risk ratios for 2021 and 2022: (Round your answers to 1 decimal place.) 2021 2022 JUUUU U UU 211, VUU (101,500). (70,500 $1,026,100 $904,600 (43,000) $757, 120 Equipment Less: Accumulated depreciation Total assets Liabilities and Stockholders' Equity Current liabilities: Accounts payable Interest payable Income tax payable Long-term liabilities: Notes payable Stockholders' equity: Common stock Retained earnings Total liabilities and stockholders' equity 175,800 9,300 12,100 $ 67,000 6,200 15,500 $115, 420 3,100 14,100 410,000 286,000 226,000 301,000 117,900 $1,026,100 301,000 228,900 $904,600 301,000 97,500 $757, 120 Required: 1. Calculate the following risk ratios for 2021 and 2022: (Round your answers to 1 decimal place.) 2022 2021 times times times times Receivables turnover ratio Inventory turnover ratio Current ratio Debt to equity ratio to 1
Step by Step Solution
There are 3 Steps involved in it

Get step-by-step solutions from verified subject matter experts