

Question: Income Sheet & Balance Sheet: Application Using the income statement and balance sheet presented, compute the following ratios. Compare your results with the Industry averages.
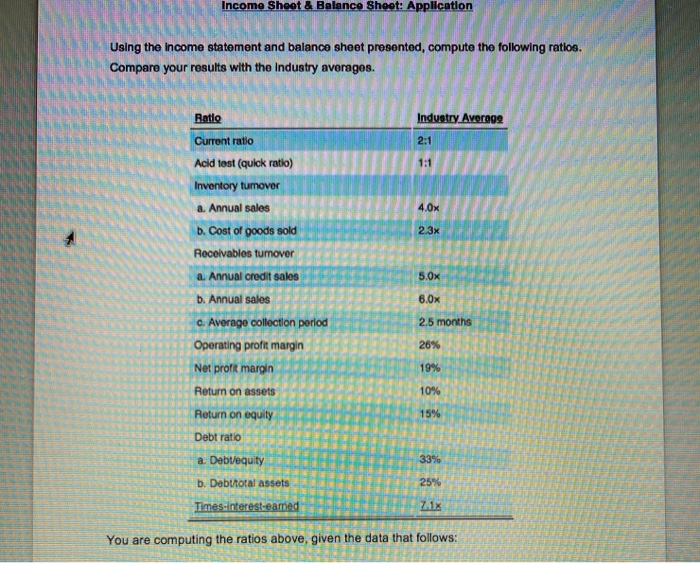
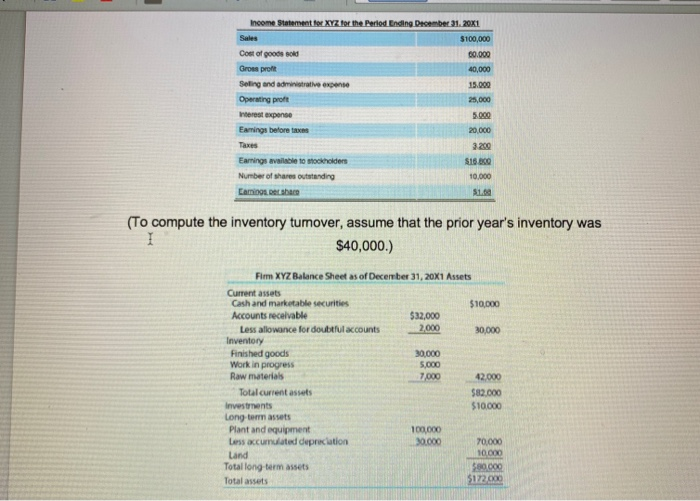
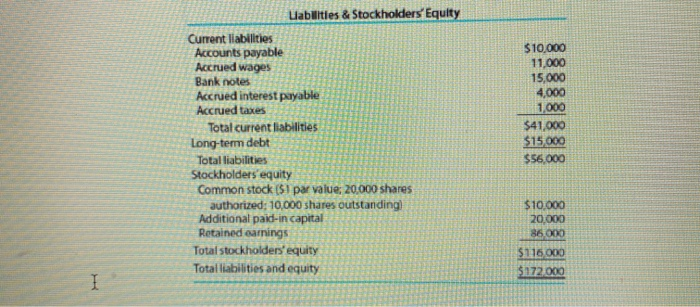
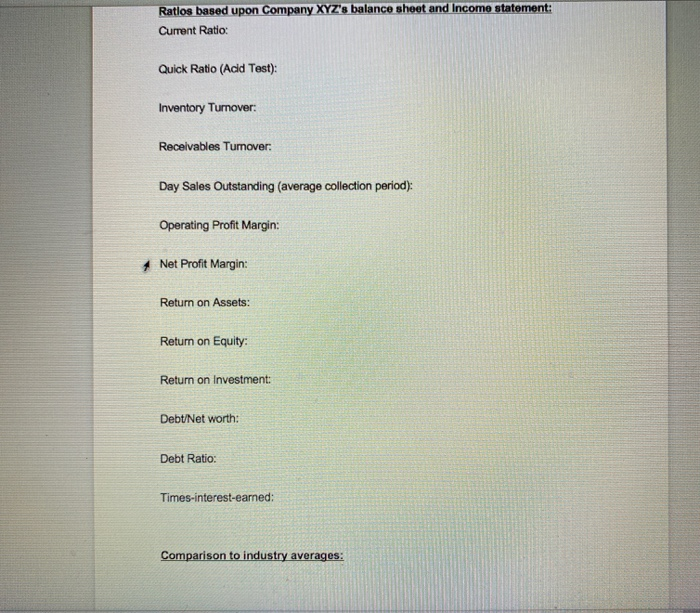
Income Sheet & Balance Sheet: Application Using the income statement and balance sheet presented, compute the following ratios. Compare your results with the Industry averages. Ratio Industry Average Current ratio 2:1 1:1 4.0x 2.3x 5.0x 6.0x Acid test (quick ratio) Inventory tumover a. Annual sales b. Cost of goods sold Receivables tumover a. Annual credit sales b. Annual sales c. Average collection period Operating profit margin Net profit margin Return on assets Return on equity Debt ratio a. Debt/equity 2.5 months 26% 19% 10% 15% 33% b. Debtotal assets 25% Times Interest-eamed 741X You are computing the ratios above, given the data that follows: Income Statement for XYZ for the Period Ending December 31, 20X1 Sales $100,000 Cost of goods sold 60.000 Gross proft 40,000 Selling and administrative expense 15.000 Operating profil 25,000 Interest expense 5.000 Eamings before time 20.000 Taxes Earnings available to stockholders $16.800 Number of shares outstanding 10.000 Caming.perhero (To compute the inventory tumover, assume that the prior year's inventory was 1 $40,000.) Fimm XYZ Balance Sheet as of December 31, 20x1 Assets Current assets Cash and marketable securities $10,000 Accounts receivable $32,000 Less allowance for doubtful accounts 2.000 30,000 Inventory Finished goods 30,000 Work in progress 5,000 Raw materials 7.000 42.000 Total current assets $82.000 Investments $10,000 Long term assets Plant and equipment 100,000 Les accumulated depreciation 30.000 70,000 Land 10.000 Total long termassets $80.000 Total assets $122.000 Uabilities & Stockholders' Equity Current liabilities Accounts payable Accrued wages Bank notes Accrued interest payable Accrued taxes Total current liabilities long-term debt Total liabilities Stockholders' equity Common stock (5) par value; 20,000 shares authorized: 10,000 shares outstanding) Additional paid-in capital Retained earnings Total stockholders'equity Total liabilities and equity $10,000 11,000 15,000 4,000 1,000 $41,000 $15,000 $56,000 $10,000 20.000 86.000 $115.000 $172 000 1 Ratlos based upon Company XYZ's balance sheet and Income statement: Current Ratio: Quick Ratio (Acid Test): Inventory Tumover: Receivables Tumover: Day Sales Outstanding (average collection period): Operating Profit Margin: Net Profit Margin: Return on Assets: Return on Equity: Return on Investment: Debt/Net worth: Debt Ratio: Times-interest-earned: Comparison to industry averages
Step by Step Solution
There are 3 Steps involved in it

Get step-by-step solutions from verified subject matter experts