

Question: Income Statement Analysis perform horizontal and vertical income statement analysis-comparing the P&L on the following page pizza following year actual to the actual P&L from
Income Statement Analysis
perform horizontal and vertical income statement analysis-comparing the P&L on the following page ""pizza following year actual" to the actual P&L from the "pizza actual budget comparison" on the columns,call the one from class "prior year" and the new one "current year"
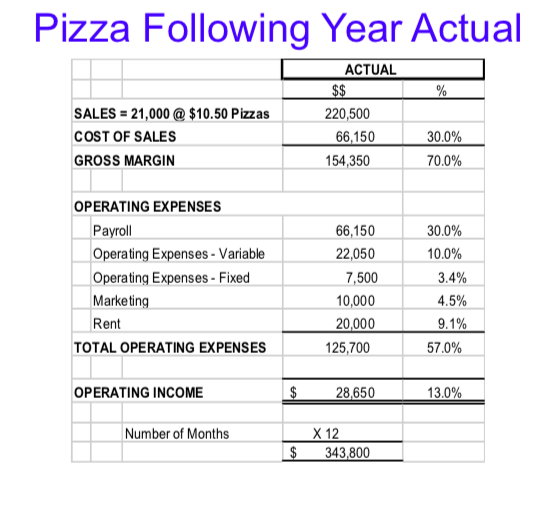
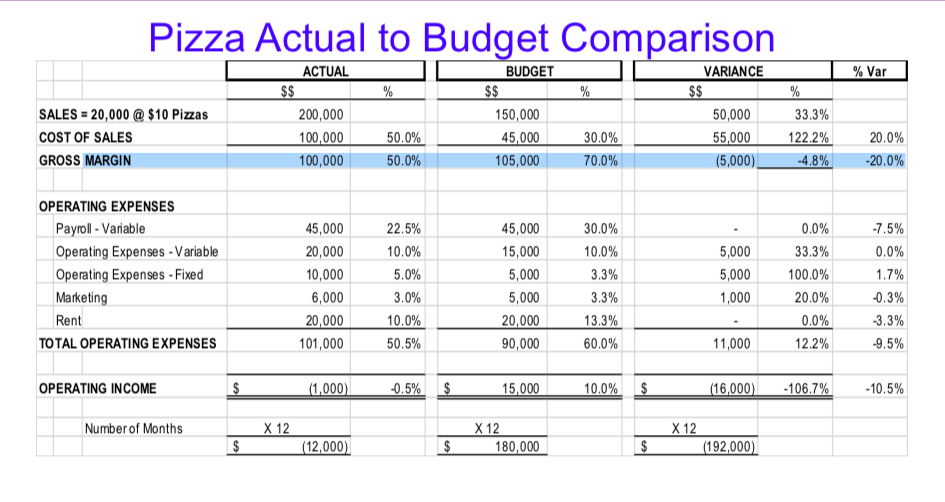
Pizza Following Year Actual % SALES = 21,000 @ $10.50 Pizzas COST OF SALES GROSS MARGIN ACTUAL $$ 220,500 66,150 154,350 30.0% 70.0% OPERATING EXPENSES Payroll Operating Expenses - Variable Operating Expenses - Fixed Marketing Rent TOTAL OPERATING EXPENSES 66,150 22,050 7,500 10,000 20,000 125,700 30.0% 10.0% 3.4% 4.5% 9.1% 57.0% OPERATING INCOME $ 28,650 13.0% Number of Months X 12 343,800 $ Pizza Actual to Budget Comparison % Var % % ACTUAL $$ 200,000 100,000 100,000 SALES = 20,000 @ $10 Pizzas COST OF SALES GROSS MARGIN BUDGET $$ 150,000 45,000 105,000 VARIANCE $$ 50,000 55,000 (5,000) % 33.3% 50.0% 50.0% 30.0% 70.0% 122.2% -4.8% 20.0% -20.0% OPERATING EXPENSES Payroll - Variable Operating Expenses - Variable Operating Expenses - Fixed Marketing Rent TOTAL OPERATING EXPENSES 45,000 20,000 10,000 6,000 20,000 101,000 22.5% 10.0% 5.0% 3.0% 10.0% 50.5% 45,000 15,000 5,000 5,000 20,000 90,000 30.0% 10.0% 3.3% 3.3% 13.3% 60.0% 5,000 5,000 1,000 0.0% 33.3% 100.0% 20.0% 0.0% 12.2% -7.5% 0.0% 1.7% -0.3% -3.3% -9.5% 11,000 OPERATING INCOME $ (1,000) -0.5% $ 15,000 10.0% $ (16,000) -106.7% -10.5% Number of Months X 12 (12,000) X 12 180,000 X 12 (192,000) $ $ $ Pizza Following Year Actual % SALES = 21,000 @ $10.50 Pizzas COST OF SALES GROSS MARGIN ACTUAL $$ 220,500 66,150 154,350 30.0% 70.0% OPERATING EXPENSES Payroll Operating Expenses - Variable Operating Expenses - Fixed Marketing Rent TOTAL OPERATING EXPENSES 66,150 22,050 7,500 10,000 20,000 125,700 30.0% 10.0% 3.4% 4.5% 9.1% 57.0% OPERATING INCOME $ 28,650 13.0% Number of Months X 12 343,800 $ Pizza Actual to Budget Comparison % Var % % ACTUAL $$ 200,000 100,000 100,000 SALES = 20,000 @ $10 Pizzas COST OF SALES GROSS MARGIN BUDGET $$ 150,000 45,000 105,000 VARIANCE $$ 50,000 55,000 (5,000) % 33.3% 50.0% 50.0% 30.0% 70.0% 122.2% -4.8% 20.0% -20.0% OPERATING EXPENSES Payroll - Variable Operating Expenses - Variable Operating Expenses - Fixed Marketing Rent TOTAL OPERATING EXPENSES 45,000 20,000 10,000 6,000 20,000 101,000 22.5% 10.0% 5.0% 3.0% 10.0% 50.5% 45,000 15,000 5,000 5,000 20,000 90,000 30.0% 10.0% 3.3% 3.3% 13.3% 60.0% 5,000 5,000 1,000 0.0% 33.3% 100.0% 20.0% 0.0% 12.2% -7.5% 0.0% 1.7% -0.3% -3.3% -9.5% 11,000 OPERATING INCOME $ (1,000) -0.5% $ 15,000 10.0% $ (16,000) -106.7% -10.5% Number of Months X 12 (12,000) X 12 180,000 X 12 (192,000) $ $ $
Step by Step Solution
There are 3 Steps involved in it

Get step-by-step solutions from verified subject matter experts