

Question: Income statement and balance sheet data for The Athletic Attic are provided below. 2. Calculate the following profitability ratios for 2018 and 2019: (Round your
Income statement and balance sheet data for The Athletic Attic are provided below.
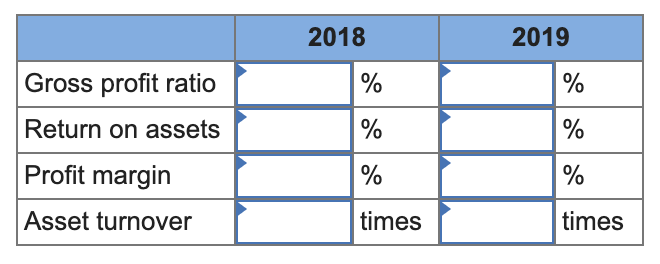
2. Calculate the following profitability ratios for 2018 and 2019: (Round your answers to 1 decimal place.)
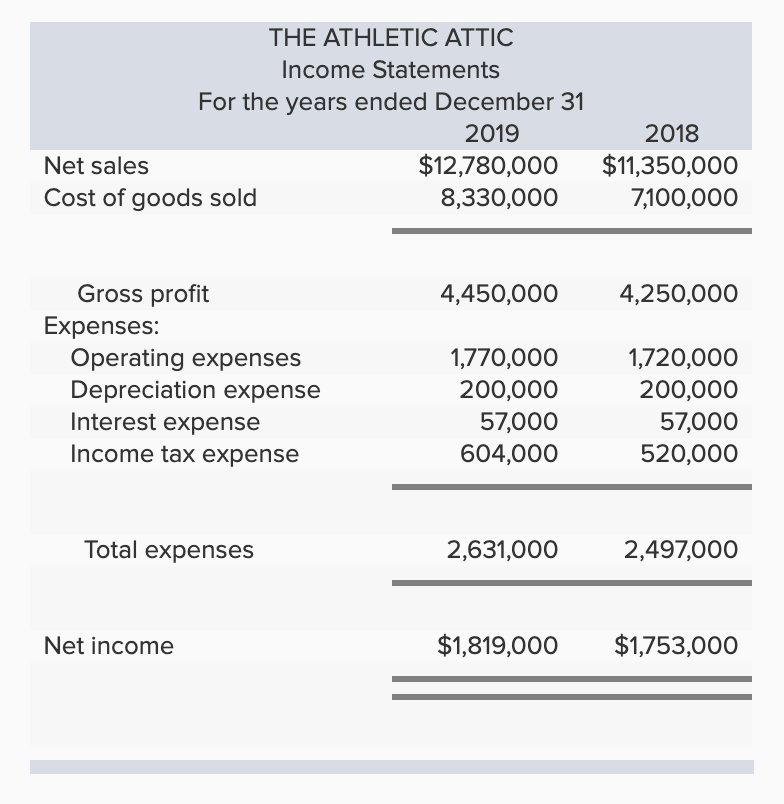
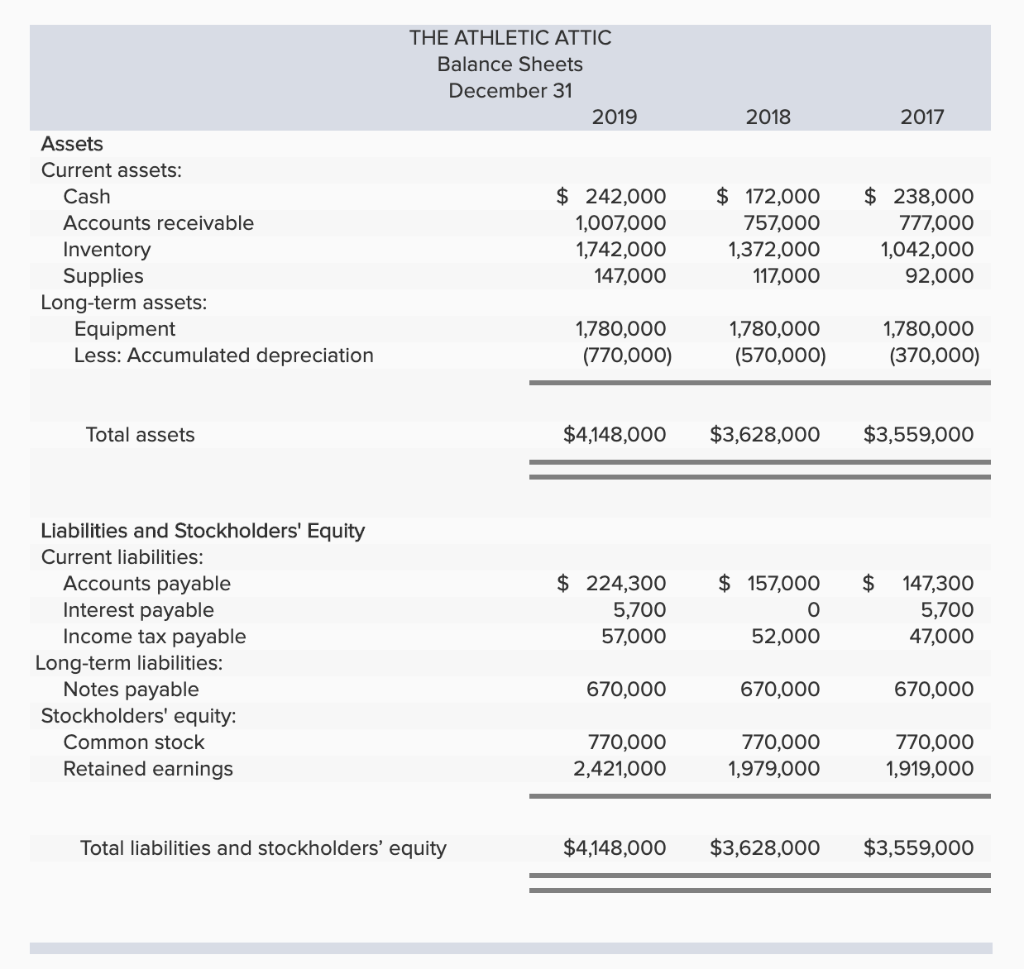
THE ATHLETIC ATTIC Income Statements For the years ended December 31 2019 2018 $12,780,000 $11,350,000 Net sales Cost of goods sold 8,330,000 7,100,000 Gross profit Expenses: Operating expenses Depreciation expense Interest expense Income tax expense 4,450,000 4,250,000 1,770,000 1,720,000 200,000 200,000 57,000 57,000 604,000 520,000 Total expenses 2,631,000 2,497,000 $1,819,000 $1,753,000 Net income THE ATHLETIC ATTIC Balance Sheets December 31 2019 2018 2017 Assets Current assets: $ 238,000 777,000 242,000 $172,000 757,000 Cash Accounts receivable 1,007,000 Inventory Supplies Long-term assets: Equipment Less: Accumulated depreciation 1,742,000 147,000 1,372,000 117,000 1,042,000 92,000 1,780,000 1,780,000 1,780,000 (770,000) (570,000) (370,000) $4,148,000 $3,628,000 $3,559,000 Total assets Liabilities and Stockholders' Equity Current liabilities: 224,300 157,000 $ 147,300 Accounts payable Interest payable Income tax payable 5,700 5,700 52,000 47,000 57,000 Long-term liabilities: Notes payable Stockholders' equity: 670,000 670,000 670,000 770,000 2,421,000 770,000 1,979,000 770,000 Common stock Retained earnings 1,919,000 $4,148,000 $3,628,000 $3,559,000 Total liabilities and stockholders' equity 2018 2019 Gross profit ratio % % Return on assets Profit margin Asset turnover times times
Step by Step Solution
There are 3 Steps involved in it

Get step-by-step solutions from verified subject matter experts