

Question: Income statement , Balance Sheet , Corporate Valuation Model, APV Compressed Valuation Model File Home Insert Draw Page Layout Formulas Data Review View Help 15

Income statement , Balance Sheet , Corporate Valuation Model, APV Compressed Valuation Model
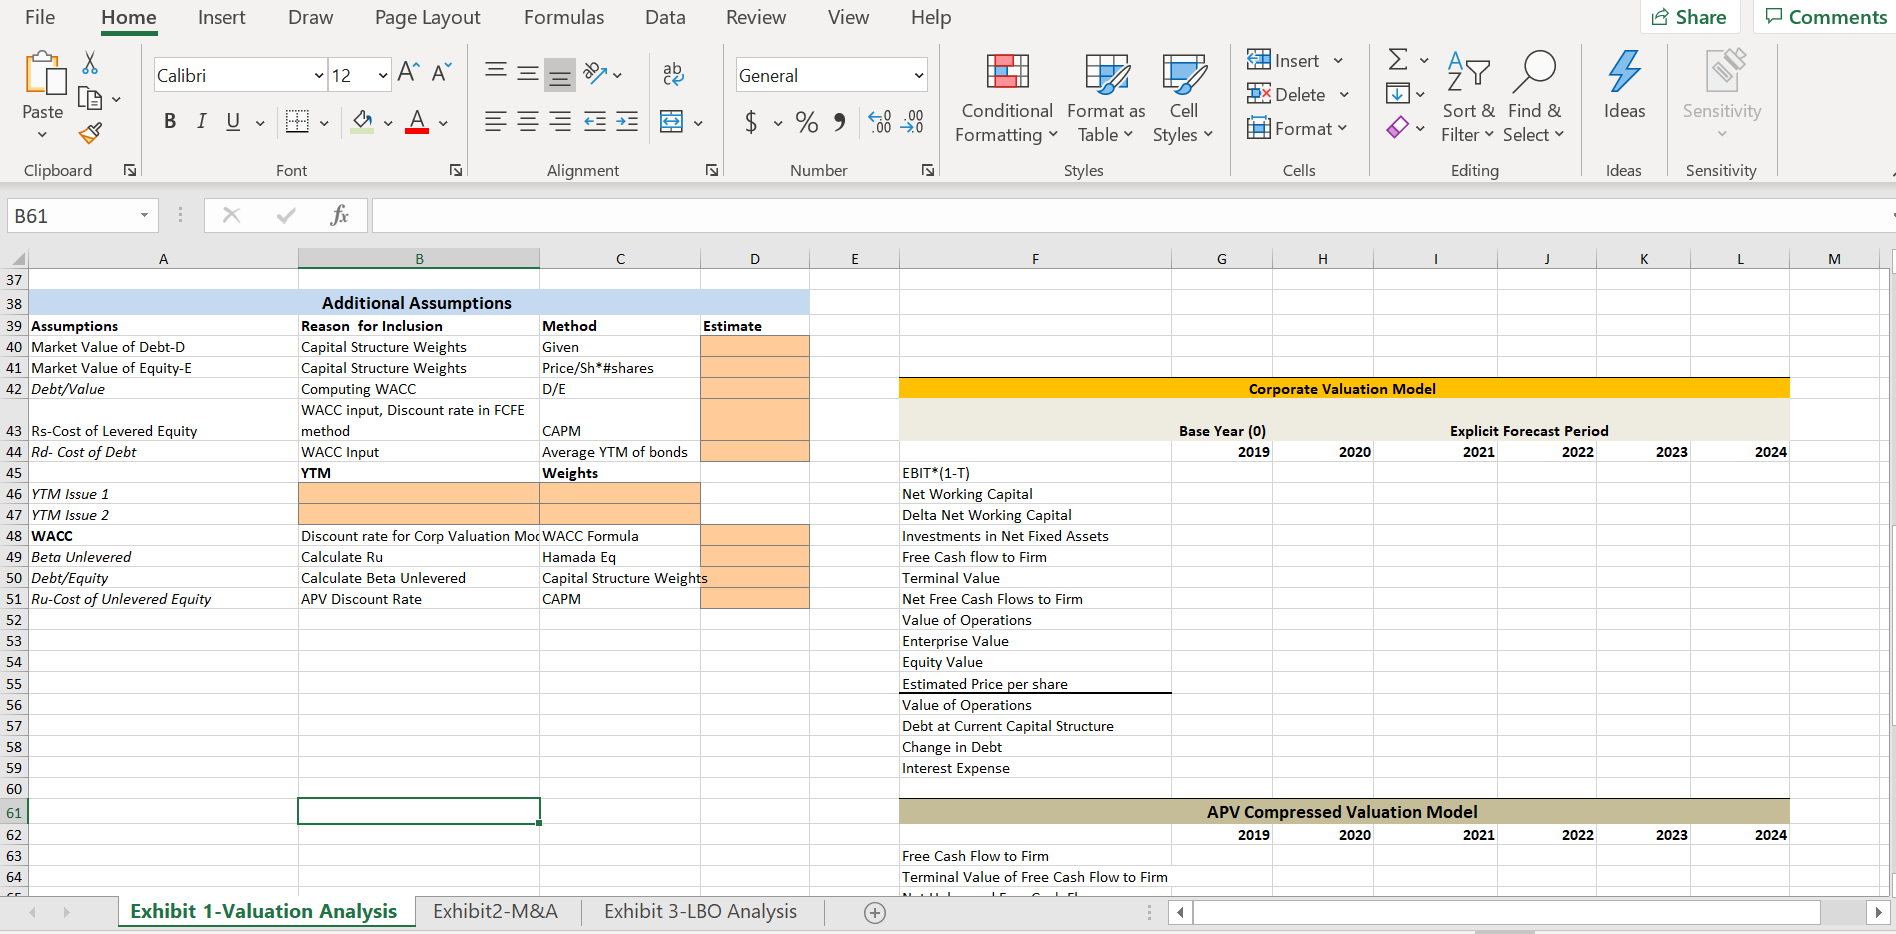
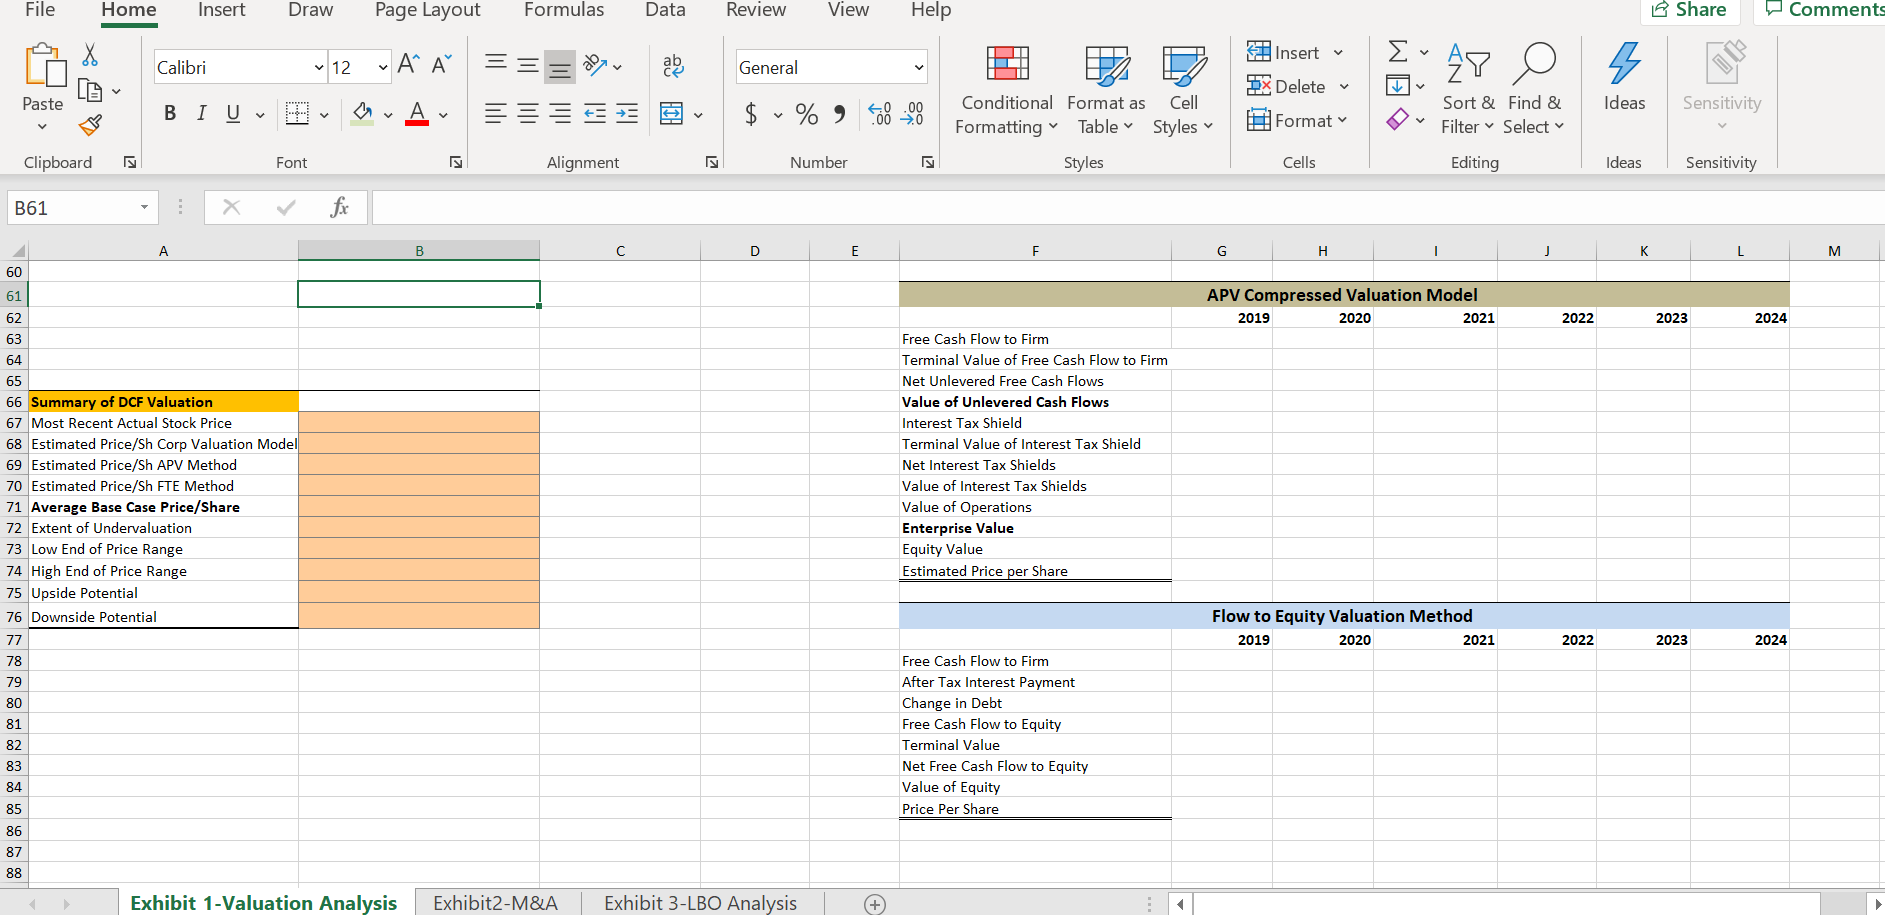

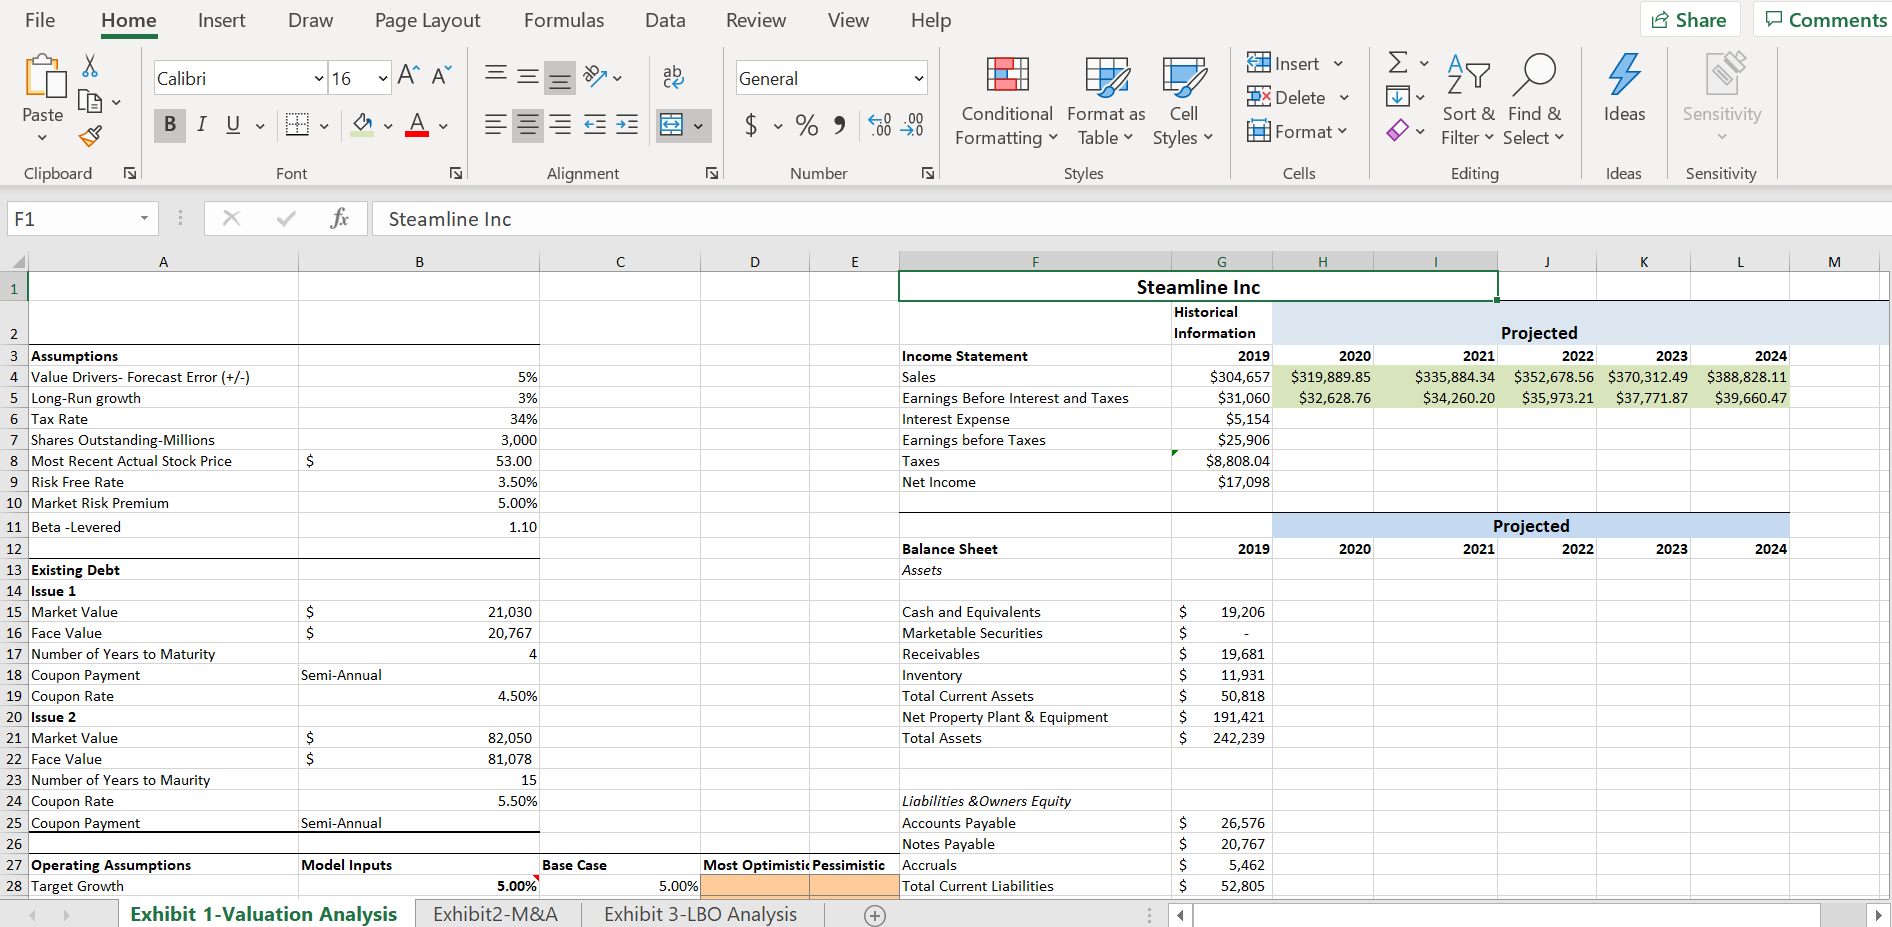
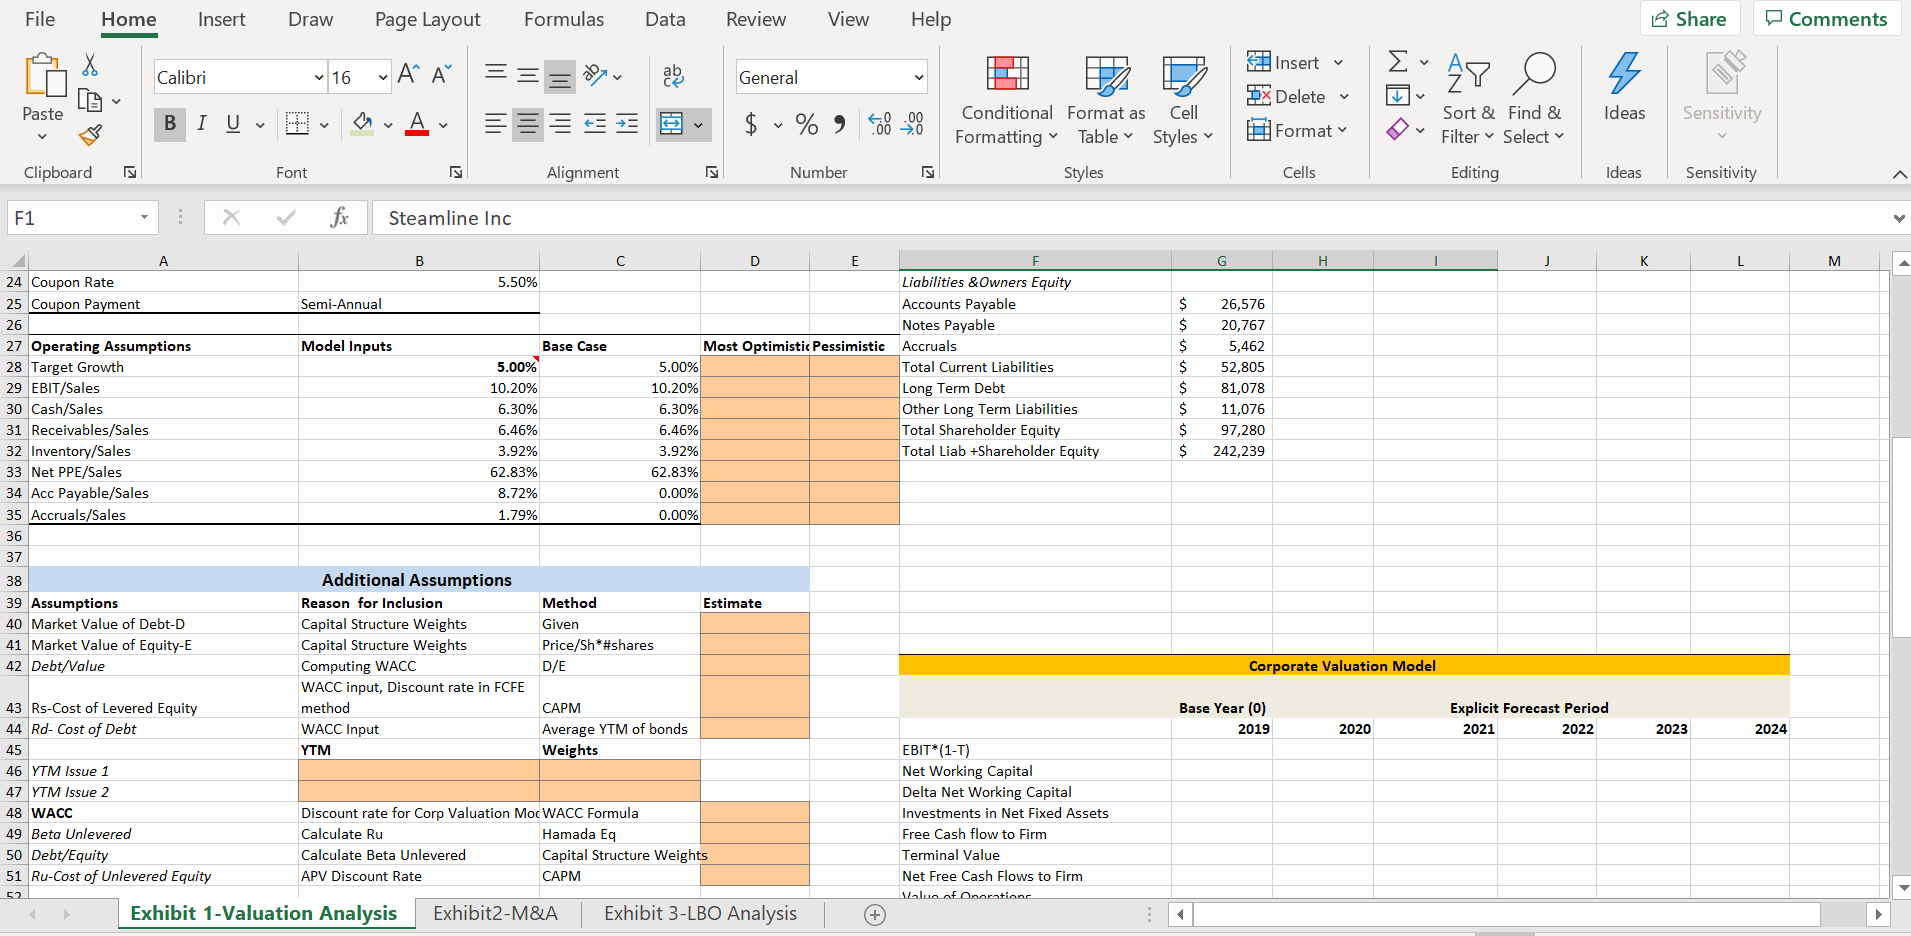
File Home Insert Draw Page Layout Formulas Data Review View Help 15 Share Comments Insert Calibri 12 ~ A" A ab General Ex A O Paste BIUVV $ ~ % 9 00 20 Conditional Format as Cell x Delete Ideas Sensitivity Formatting Table ~ Styles Format Sort & Find & Filter ~ Select Clipboard Font Alignment Number Styles Cells Editing Ideas Sensitivity B61 X V A B C D E F G H K L M 37 38 Additional Assumptions 39 Assumptions Reason for Inclusion Method Estimate 40 Market Value of Debt-D Capital Structure Weights Given 41 Market Value of Equity-E Capital Structure Weights Price/Sh*#shares 42 Debt/Value Computing WACC D/E Corporate Valuation Model WACC input, Discount rate in FCFE 43 Rs-Cost of Levered Equity method CAPM Base Year (0) Explicit Forecast Period 44 Rd- Cost of Debt WACC Input Average YTM of bonds 2019 2020 2021 2022 2023 2024 45 TM Weights EBIT*(1-T) 46 YTM Issue 1 Net Working Capital 47 YTM Issue 2 Delta Net Working Capital 48 WACC Discount rate for Corp Valuation MocWACC Formula Investments in Net Fixed Assets 49 Beta Unlevered Calculate Ru Hamada Eq Free Cash flow to Firm 50 Debt/Equity Calculate Beta Unlevered Capital Structure Weights Terminal Value 51 Ru-Cost of Unlevered Equity APV Discount Rate CAPM Net Free Cash Flows to Firm 52 Value of Operations 53 Enterprise Value 54 Equity Value 55 Estimated Price per share 56 Value of Operations 57 Debt at Current Capital Structure 58 Change in Debt 59 Interest Expense 60 61 APV Compressed Valuation Model 62 2019 2020 2021 2022 2023 2024 63 Free Cash Flow to Firm 64 Terminal Value of Free Cash Flow to Firm Exhibit 1-Valuation Analysis Exhibit2-M&A Exhibit 3-LBO Analysis +File Home Insert Draw Page Layout Formulas Data Review View Help 15 Share Comments Insert Calibri 12 A A ag General BIUV $ ~ % " Conditional Format as Delete v E AP O Paste .00 Sort & Find & Ideas v VA 100 -0 Cell Sensitivity Formatting Table Styles Format Filter ~ Select Clipboard Font Alignment Number Styles Cells Editing Ideas Sensitivity B61 X A B C D E F G H K M 60 61 APV Compressed Valuation Model 62 2019 2020 2021 2022 2023 2024 63 Free Cash Flow to Firm 64 Terminal Value of Free Cash Flow to Firm 65 Net Unlevered Free Cash Flows 66 Summary of DCF Valuation Value of Unlevered Cash Flows 67 Most Recent Actual Stock Price Interest Tax Shield 68 Estimated Price/Sh Corp Valuation Model Terminal Value of Interest Tax Shield 69 Estimated Price/Sh APV Method Net Interest Tax Shields 70 Estimated Price/Sh FTE Method Value of Interest Tax Shields 71 Average Base Case Price/Share Value of Operations 72 Extent of Undervaluation Enterprise Value 73 Low End of Price Range Equity Value 74 High End of Price Range Estimated Price per Share 75 Upside Potential 76 Downside Potential Flow to Equity Valuation Method 77 2019 2020 2021 2022 2023 2024 78 Free Cash Flow to Firm 79 After Tax Interest Payment 80 Change in Debt 81 Free Cash Flow to Equity 82 Terminal Value 83 Net Free Cash Flow to Equity 84 Value of Equity 85 Price Per Share 86 87 88 Exhibit 1-Valuation Analysis Exhibit2-M&A Exhibit 3-LBO Analysis (+)File Home Insert Draw Page Layout Formulas Data Review View Help Share Comments Calibri 16 ~ A" A Insert v General Ex AY O Paste CA v Conditional Format as Cell 2x Delete BIUVV $ ~ % 9 08 0 Formatting Table Styles Format Sort & Find & Ideas Sensitivity Filter ~ Select v Clipboard Font Alignment Number Styles Cells Editing Ideas Sensitivity F1 X fix Steamline Inc A B C D E G H J K M 24 Coupon Rate 5.50% Liabilities &Owners Equity 25 Coupon Payment Semi-Annual Accounts Payable 26,576 26 Notes Payable 20,767 27 Operating Assumptions Model Inputs Base Case Most Optimistic Pessimistic Accruals 5.462 28 Target Growth 5.00% 5.00% Total Current Liabilities 52,805 29 EBIT/Sales 10.20% 10.20% Long Term Debt 81,078 30 Cash/Sales 6.30% 6.30% Other Long Term Liabilities 11,076 31 Receivables/Sales 6.46% 6.46% Total Shareholder Equity 97,280 32 Inventory/Sales 3.92% 3.92% Total Liab +Shareholder Equity 242,239 33 Net PPE/Sales 62.83% 62.83% 34 Acc Payable/Sales 8.72% 0.00% 35 Accruals/Sales 1.79% 0.00% 36 37 38 Additional Assumptions 39 Assumptions Reason for Inclusion Method Estimate 40 Market Value of Debt-D Capital Structure Weights Given 41 Market Value of Equity-E Capital Structure Weights Price/Sh*#shares 42 Debt/Value Computing WACC D/E Corporate Valuation Model WACC input, Discount rate in FCFE 43 Rs-Cost of Levered Equity method CAPM Base Year (0) Explicit Forecast Period 44 Rd- Cost of Debt WACC Input Average YTM of bonds 2019 2020 2021 2022 2023 2024 45 YTM Weights EBIT*(1-T) 46 YTM Issue 1 Net Working Capital 47 YTM Issue 2 Delta Net Working Capital 48 WACC Discount rate for Corp Valuation MocWACC Formula Investments in Net Fixed Assets 49 Beta Unlevered Calculate Ru Hamada Eq Free Cash flow to Firm 50 Debt/Equity Calculate Beta Unlevered Capital Structure Weights Terminal Value 51 Ru-Cost of Unlevered Equity APV Discount Rate CAPM Net Free Cash Flows to Firm Value of Onorations Exhibit 1-Valuation Analysis Exhibit2-M&A Exhibit 3-LBO AnalysisFile Home Insert Draw Page Layout Formulas Data Review View Help Share Comments 16 ~ A" A = ag General Insert v Calibri x Delete Paste BIUV $ ~ % 9 00 20 Conditional Format as Cell Sort & Find & Ideas Sensitivity v Formatting " Table Styles v Format Filter > Select v Clipboard Font Alignment Number Styles Cells Editing Ideas Sensitivity F1 X V Steamline Inc A B C D E F H K M Steamline Inc Historical 2 Information Projected 3 Assumptions Income Statement 2019 2020 2021 2022 2023 2024 4 Value Drivers- Forecast Error (+/-) 5% Sales $304,657 $319,889.85 $335,884.34 $352,678.56 $370,312.49 $388,828.11 5 Long-Run growth 3% Earnings Before Interest and Taxes $31,060 $32,628.76 $34,260.20 $35,973.21 $37,771.87 $39,660.47 6 Tax Rate 34% Interest Expense $5,154 7 Shares Outstanding-Millions 3,000 Earnings before Taxes $25,906 8 Most Recent Actual Stock Price $ 53.00 Taxes $8,808.04 9 Risk Free Rate 3.50% Net Income $17,098 10 Market Risk Premium 5.00% 11 Beta -Levered 1.10 Projected 12 Balance Sheet 2019 2020 2021 2022 2023 2024 13 Existing Debt Assets 14 Issue 1 15 Market Value 21,030 Cash and Equivalents 19,206 16 Face Value 20,767 Marketable Securities 17 Number of Years to Maturity Receivables 19,681 18 Coupon Payment Semi-Annual Inventory 11,931 19 Coupon Rate 4.50% Total Current Assets 50,818 20 Issue 2 Net Property Plant & Equipment 191,421 21 Market Value 82,050 Total Assets 242,239 22 Face Value 81,078 23 Number of Years to Maurity 15 24 Coupon Rate 5.50% Liabilities &Owners Equity 25 Coupon Payment Semi-Annual Accounts Payable 26,576 26 Notes Payable 20,767 27 Operating Assumptions Model Inputs Base Case Most OptimisticPessimistic Accruals 5,462 28 Target Growth 5.00% 5.00% Total Current Liabilities 52,805 Exhibit 1-Valuation Analysis Exhibit2-M&A Exhibit 3-LBO Analysis
Step by Step Solution
There are 3 Steps involved in it

Get step-by-step solutions from verified subject matter experts