

Question: Income Statement - Horizontal Analysis 9. In the [Inc-H] sheet, complete computing annual changes for each line item on the income statement. On the [MD+A]
![Income Statement - Horizontal Analysis 9. In the [Inc-H] sheet, complete](https://dsd5zvtm8ll6.cloudfront.net/si.experts.images/questions/2024/09/66f7b88c4379c_66766f7b88bdc53d.jpg)
![the [MD+A] worksheet (spreadsheet rows 6-22) Tesla provides a horizontal analysis of](https://dsd5zvtm8ll6.cloudfront.net/si.experts.images/questions/2024/09/66f7b88dd4f2d_66966f7b88d54c0e.jpg)
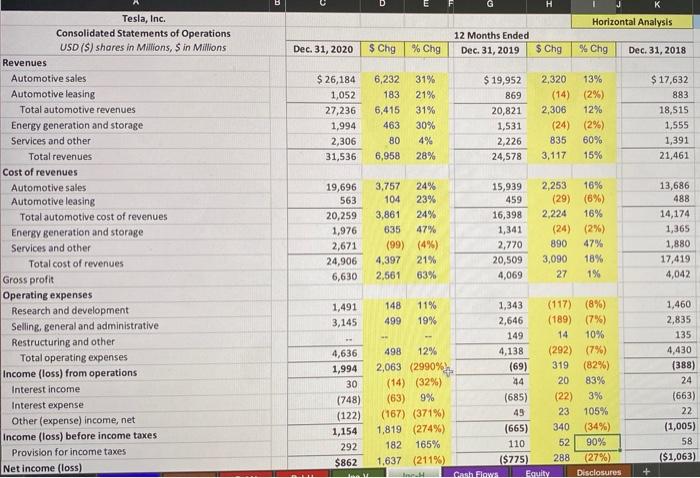

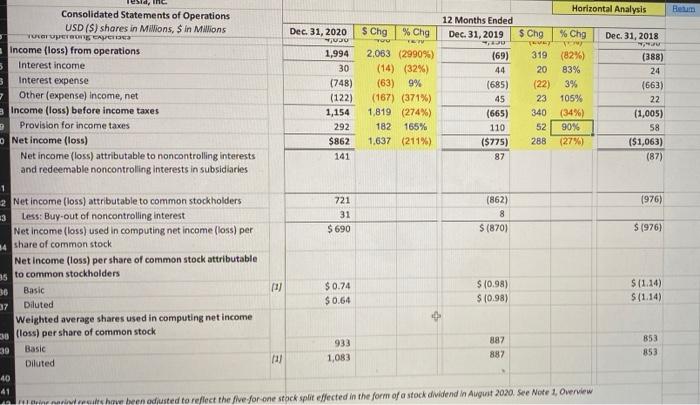
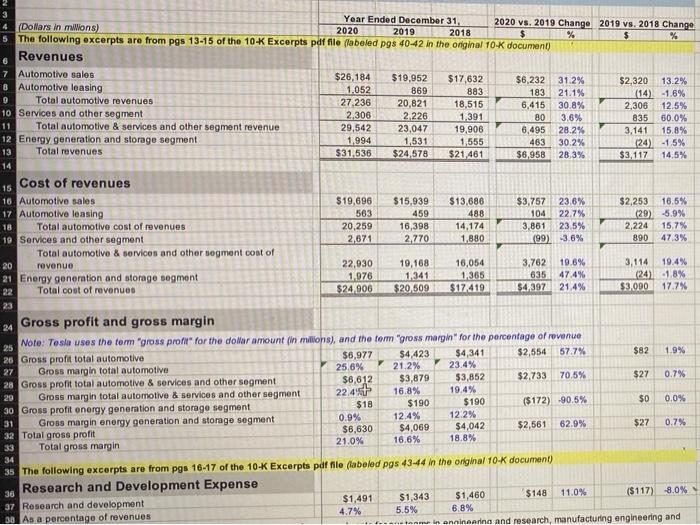
Income Statement - Horizontal Analysis 9. In the [Inc-H] sheet, complete computing annual changes for each line item on the income statement. On the [MD+A] worksheet (spreadsheet rows 6-22) Tesla provides a horizontal analysis of revenues and cost of revenues for its operating segments. It also provides (rows 24-33) a horizontal analysis and vertical analysis of gross profits. Change From 2019 to 2020 Change From 2018 to 2019 Percent change in revenue from the 10. Automotive segment (both sales & leasing) Percent change in cost of revenue from 11. the Automotive segment (both sales & leasing) Percent change in gross profit from the 12. Automotive segment (both sales & leasing) Balance Sheet - Vertical common Sizol Anahiri 890 3 4 (Dollars in millions) Year Ended December 31, 2020 vs. 2019 Change 2019 vs. 2018 Change 2020 The following excerpts are from Pgs 13-15 of the 10-K Excerpts pdf file flabeled pgs 40-42 in the original 10-K document) 2019 2018 % $ % Revenues 7 Automotive sales $26,184 8 Automotive leasing $19,952 $17,632 $6,232 31.2% $2,320 13.2% 1.052 869 883 9 Total automotive revenues 183 21.1% (14) -1.6% 27 236 20,821 10 Services and other segment 18,515 6,415 30.8% 2,306 12.5% 2,306 2.226 1,391 11 80 3,6% Total automotive & services and other segment revenue 835 60.0% 29,542 23,047 19,906 6,495 12 Energy generation and storage segment 28.2% 3,141 15.8% 1,994 1,531 1,555 463 30.2% 13 Total revenues (24) -15% $31,536 $24,578 $21,461 $6,958 28.3% $3,117 14.5% 14 Cost of revenues 15 16 Automotive sales $19,696 $15,939 $13,686 $3,757 23.6% $2,253 16.5% 17 Automotive leasing 563 459 488 104 22.7% (29) 5.9% 18 Total automotive cost of revenues 20,259 16,398 14,174 3,861 23.5% 2,224 15.7% 19 Services and other segment 2,671 2.770 1,880 (199) -3.6% 473% Total automotive & services and other sogment cost of 20 revenue 22,030 19,168 16,054 3,762 19.6% 3,114 19.4% 21 Energy generation and storage segment 1.976 1.341 1.365 635 47.4% (24) -1.8% 22 Total cost of revenues $24,906 $20,509 $17419 $4,397 21.4% $3,000 17.7% 23 Gross profit and gross margin 24 25 Note: Tesla uses the term "gross profit" for the dollar amount (in Millions), and the term "gross margin" for the percentage of revenue $6,977 $4,423 $4,341 $2,554 26 Gross profit total automotive 57.7% 1.9% 27 Gross margin total automotive 25.6% 21.2% 23.4% $6,612 $3,879 $3,852 $2,733 28 Gross profit total automotive & services and other segment 70.5% 0.7% 29 22.47 19.4% Gross margin total automotive & services and other segment 16.8% $18 $190 $190 $0 ($172) -90.5% 0.0% 30 Gross profit energy generation and storage segment 12.4% 0.9% 31 Gross margin energy generation and storage segment 12.2% $4,042 $6,630 $4,069 62.9% $2,561 32 Total gross profit 0.7% 16.6% 21.0% 18.8% 33 Total gross margin 34 35 The following excerpts are from pgs 16-17 of the 10-K Excerpts pdf file (labeled pgs 43-44 in the original 10-K document) Research and Development Expense 38 $1,343 $1,491 $1,460 $148 11.0% ($117) 8.0% 37 Research and development 4.7% 5.5% 6.8% 30 As a percentage of revenues In an inaarina and research, manufacturing engineering and $82 $27 $27 40 3 Year Ended December 31 2020 vs. 2019 Change 2019 vs. 2018 Change + Dolars in milions) 2020 2019 2018 $ % $ 31 Gross margin energy generation and storage segment 0.9% 12.4% 12.2% 12 Total gross profit $6,630 $4,069 $4,042 $2,561 62.9% $27 0.7% 13 Total gross margin 21.0% 16.6% 18.8% 14 35 The following excerpts are from pgs 16-17 of the 10-K Excerpts pdf file (abolod pgs 43-44 in the original 10K document) 36 Research and Development Expense 37 Research and development $1,491 $1,343 $1,460 5148 11.0% ($117) 8.0% 38 As a percentage of revenues 4.7% 5.5% 6.8% 39 Research and dovelopment (R&D) expenses consist primarily of personnel costs for our teams in engineering and research, manufacturing engineering and manufacturing test organizations, prototyping expense, contract and professional services and amortized equipment expense 41 R&D expenses increased $148 milion, or 11%, in the year ended December 31, 2020 as compared to the year ended December 31, 2019. The increase was 42 primarily due to a $62 million increase in expensed materials as we continue to expand our product roadmap. $61 million increase in stock-based compensation 43 expense primarily related to the issuance of equity awards in fiscal year 2020 at higher grant date fair values due to our increased share price, $20 million increase in facilities, freight and depreciation expenses and a $20 million increase in employeo and labor related expenses. R&D expenses as a porcentage of revenue decreased from 5.5% to 4.7% in the year ended December 31, 2020 as compared to the year ended December 31, 2019. The decrease is primarily an increase in total revenues from expanding sales, partially offset by an increase in our R&D expenses as detailed above. Selling, General and Administrative Expense 49 Selling, general and administrative $3,145 $2,646 $2,835 $499 18.0% (5189) 6.7% 50 As a porcentage of revenues 10.0% 10.8% 13.2% Seling, general and administrative ("SG&A") expenses generaly consist of personnel and facilities costs related to our storos, marketing, sales, executive 52 finance, human resources, information technology and legal organizations, as well as fees for professional and contract services and litigation settlements. 53 54 SG&A expenses increased $499 million, or 19%, in the year ended December 31, 2020 as compared to the year ended December 31, 2019. The increase is 55 primarily due to an increase of $625 million in stock-based compensation expense, of which $542 million was attrbutable to the 2018 CEO rhomance Award 56 We recorded stock-based compensation expense of $838 million in the year ended December 31, 2020 for the 2018 CEO Performance Award compared to 57 $206 milion in the prior year. Of the expense recorded in fiscal year 2020, 5232 million was due to cumulative catch-up expense for the service provided from the grant date when three operational milestones under such award wore considered probable of being met and the remaining unamortized expense of $357 million for the first four tranches were recognized upon vesting as the first four market capitalization milestones were achieved (seo Note 14. Equity Incentive Plans, to the consolidated financial statements included elsewhere in this Annual Report on Form 10-K). The remaining stock-based compensation expense 62 increase of $83 million attributable to other directors and employees is primarily related to the issuance of equity awards in fiscal year 2020 at higher grant date 69 fair values due to our increased share price. The increase in stock-based compensation was partially offset by a decrease of $90 million in customer promotional 64 costs, facilities related expenses and sales and marketing activities. Additionally, there was a reduction to operating expenses for costs previously incurred in 65 the amount of $43 million for the settiment in part of the secuntios itigation relating to the SolarCity acquisition (soo Note 16, Commitments and 68 Contingencies Legal Proceedings Securities Litigation Relating to the SolarCity Acquisition to the consolidated financial statements included elsewhere in QUOA WADOS a piced Ur TUVITU VINU HISTU W und I, LULU U UU W yar U HOT 2019. The decrease is primary from an increase in total revenues from expanding salos, partially offset by an increase in our SG&A expenses as detailed 44 45 46 47 48 51 58 50 60 61 67 68 69 B Horizontal Analysis Dec 31, 2020 $ Chg 12 Months Ended Dec 31, 2019 % Chg $ Chg %Chg Dec 31, 2018 $ 26,184 1,052 27,236 1,994 2,306 31,536 6,232 183 6,415 463 80 6,958 31% 21% 31% 30% 4% 28% $ 19,952 869 20,821 1,531 2,226 24,578 2,320 13% (14) (2%) 2,306 12% (24) (2%) 835 60% 3,117 15% $ 17,632 883 18,513 1,555 1,391 21,461 Tesla, Inc. Consolidated Statements of Operations USD ($) shores in Millions, Sin Millions Revenues Automotive sales Automotive leasing Total automotive revenues Energy generation and storage Services and other Total revenues Cost of revenues Automotive sales Automotive leasing Total automotive cost of revenues Energy generation and storage Services and other Total cost of revenues Gross profit Operating expenses Research and development Selling, general and administrative Restructuring and other Total operating expenses Income (loss) from operations Interest income Interest expense Other (expense) income, net Income (loss) before income taxes Provision for income taxes Net income (loss) 19,696 563 20,259 1,976 2,671 24,906 6,630 3,757 24% 104 23% 3,861 24% 635 47% (99) (4%) 4,397 21% 2,561 63% 15,939 459 16,398 1,341 2,770 20,509 4,069 2,253 16% (29) (6%) 2,224 16% (24) (2%) 890 47% 3,090 18% 27 1% 13,686 488 14,174 1,365 1,880 17,419 4,042 1,491 3,145 4,636 1,994 30 (748) (122) 1,154 292 $862 148 11% 1,343 (117) (8%) 499 19% 2,646 (189) (7%) 149 14 10% 498 12% 4,138 (292) (7%) 2,063 (2990% (69) 319 (82%) (14) (32%) 44 20 83% (63) 9% (685) (22) 3% (167) (371%) 49 23 105% 1,819 (274%) (665) 340 (34%) 182 165% 110 52 90% 1,637 (211%) ($775) 288 (27%) Cash Flows Faulty Disclosures 1,460 2,835 135 4,430 (388) 24 (663) 22 (1,005) 58 ($1,063) B Horizontal Analysis Dec 31, 2020 $ Chg 12 Months Ended Dec 31, 2019 % Chg $ Chg %Chg Dec 31, 2018 $ 26,184 1,052 27,236 1,994 2,306 31,536 6,232 183 6,415 463 80 6,958 31% 21% 31% 30% 4% 28% $ 19,952 869 20,821 1,531 2,226 24,578 2,320 13% (14) (2%) 2,306 12% (24) (2%) 835 60% 3,117 15% $ 17,632 883 18,513 1,555 1,391 21,461 Tesla, Inc. Consolidated Statements of Operations USD ($) shores in Millions, Sin Millions Revenues Automotive sales Automotive leasing Total automotive revenues Energy generation and storage Services and other Total revenues Cost of revenues Automotive sales Automotive leasing Total automotive cost of revenues Energy generation and storage Services and other Total cost of revenues Gross profit Operating expenses Research and development Selling, general and administrative Restructuring and other Total operating expenses Income (loss) from operations Interest income Interest expense Other (expense) income, net Income (loss) before income taxes Provision for income taxes Net income (loss) 19,696 563 20,259 1,976 2,671 24,906 6,630 3,757 24% 104 23% 3,861 24% 635 47% (99) (4%) 4,397 21% 2,561 63% 15,939 459 16,398 1,341 2,770 20,509 4,069 2,253 16% (29) (6%) 2,224 16% (24) (2%) 890 47% 3,090 18% 27 1% 13,686 488 14,174 1,365 1,880 17,419 4,042 1,491 3,145 4,636 1,994 30 (748) (122) 1,154 292 $862 148 11% 1,343 (117) (8%) 499 19% 2,646 (189) (7%) 149 14 10% 498 12% 4,138 (292) (7%) 2,063 (2990% (69) 319 (82%) (14) (32%) 44 20 83% (63) 9% (685) (22) 3% (167) (371%) 49 23 105% 1,819 (274%) (665) 340 (34%) 182 165% 110 52 90% 1,637 (211%) ($775) 288 (27%) Cash Flows Faulty Disclosures 1,460 2,835 135 4,430 (388) 24 (663) 22 (1,005) 58 ($1,063) Beum $ Chg $ Chg % Chg ET TE (22) Consolidated Statements of Operations Horizontal Analysis USD (S) shares in Millions, Sin Millions 12 Months Ended TULO VIVOTECA Dec 31, 2020 %Chg Dec 31, 2019 ju Dec. 31, 2018 Income (loss) from operations 1,994 2.063 (2990%) (69) 319 (82%) Interest income (388) 30 (14) (32%) 44 20 83% 24 Interest expense (748) (63) 9% (685) 3% (663) Other (expense) Income, net (122) (167) (371%) 45 23 105% 22 Income (loss) before income taxes 1,154 1,819 (274%) (665) 340 (34%) (1,005) Provision for income taxes 292 182 165% 110 52 90% 58 Net income (loss) $862 1.637 (211%) ($775) 288 (27%) ($1,063) Net income (loss) attributable to noncontrolling interests 141 87 (87) and redeemable noncontrolling Interests in subsidiaries 1 2 Net income (loss) attributable to common stockholders 721 (862) (976) 13 Less: Buy-out of noncontrolling interest 31 8 Net inco (loss) used in computing net income (loss) per $ 690 $(870) S 1976) share of common stock Net Income (loss) per share of common stock attributable as to common stockholders Basic DI 36 $ 0.74 $10.98) $11.14) $0.64 S (0.98) $(1.14) Diluted 37 Weighted average shares used in computing net income 30 loss) per share of common stock 933 887 853 39 Basic 887 853 Diluted 1,083 40 41 line. how been adusted to reflect the five for one stock split effected in the form of a stock dividend in August 2020. See Note 1, Overview 11
Step by Step Solution
There are 3 Steps involved in it

Get step-by-step solutions from verified subject matter experts