

Question: Income statement See Table 2.5 showing financial statement data and stock price data for Mydeco Corp. Suppose Mydeco repurchases 2 million shares each year from
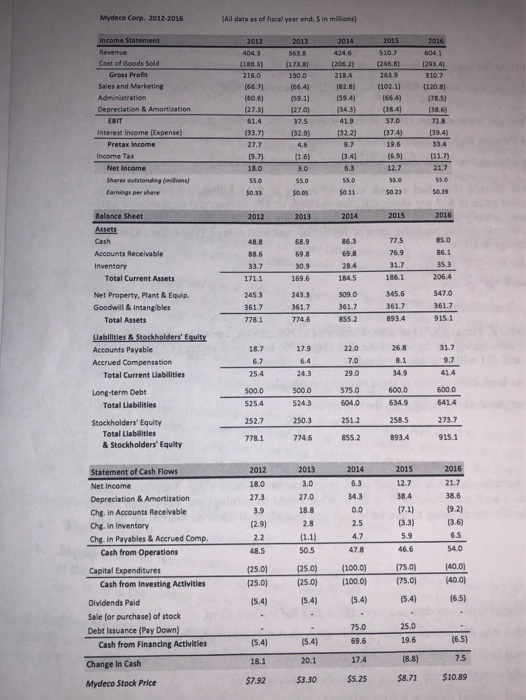
Income statement See Table 2.5 showing financial statement data and stock price data for Mydeco Corp. Suppose Mydeco repurchases 2 million shares each year from 2013 to 2016. What would its earnings per share be in 2016? (Assume Mydeco pays for the shares using its available cash and that Mydeco carns no interest on its cash balances.) Statement of cash flows 2. See Table 2.5 showing financial statement data and stock price data for Mydeco Corp. a. From 2012 to 2016, what was the total cash flow from operations that Mydeco generated? b. What fraction of the total in (a) was spent on capital expenditures? c. What fraction of the total in (a) was spent paying dividends to shareholders? d. What was Mydeco's total retained earnings for this period? Table 2.5 Mydece Corp. 2012-2016 (All data as of fiscal year end; Sin million) Income Statement 2012 2013 2015 2016 3533 (173.8) 1900 4246 206.2) Cost of Goods Sold Gross Profit Sales and Marketing Administration Depreciation Amortation (168.3) 216.0 1667) (1021) 1664) 159.10 01203 (785 (273) (343) (384) 570 419 723 194) Interest income pense Pretax income 97 19.6 (1.6) 27.7 19.7) 18.0 55.0 $0:33 Net Income Theresettings 127 21.7 $0.11 $03 $0.38 Balance Sheet 2012 2014 2015 2015 689 86.3 Cash Accounts Receivable Inventor Total Current Assets 775 76.9 317 186.1 35.3 33.7 171.1 30.9 169.6 205.4 2453 361.7 778.1 2433 361.7 7746 309.0 361.7 8552 893.4 Net Property, Plant & Equip. Goodwill & Intangibles Total Assets Uabilities & Stockholders' Equity Accounts Payable Accrued Compensation Total Current abilities 18. 7 6.7 25.4 179 6,4 24.3 22.0 7.0 29.0 26.8 8.1 349 Long-term Debt Total Liabilities 600.0 634.9 500.0 525.4 252.7 778.1 500.0 524.3 2503 774.6 575.0 604.0 2512 855.2 258.5 Stockholders' Equity Total Liabilities & Stockholders' Equity 2012 2013 2014 2015 12.7 18.0 273 27.0 3.9 07.11 2.5 033) 13.6) (2.9) 2.2 485 (11) SOS 466 540 (250) Statement of Cash Flows Net Income Depreciation & Amortization CheIn Accounts Receivable Chein Inventory O in Payables & Accrued Comp. Cash from Operations Capital Expenditures Cash from Investing Activities Dividends Paid Sale for purchase) of stock Debt Issuance (Pay Down) Cash from Financing Activities Change in Cash Mydeco Stock Price (1000) (100.00 (75.00 (750) (250) (25.01 1.4) (25.0) 15.4 15.4) 75.0 25.0 (5.4) 18.1 (5.4) 20.1 $3.30 17.4 $5.25 (3.8) $8.71 $7.92 $10.89
Step by Step Solution
There are 3 Steps involved in it

Get step-by-step solutions from verified subject matter experts