

Question: Income Statement Shae's Comparative Income Statement Difference $ % Last Year This Year 1,880,000 2,001,090 220,200 301,300 330,400 84,400 378,500 89,020 SALES: Food Beverage Total
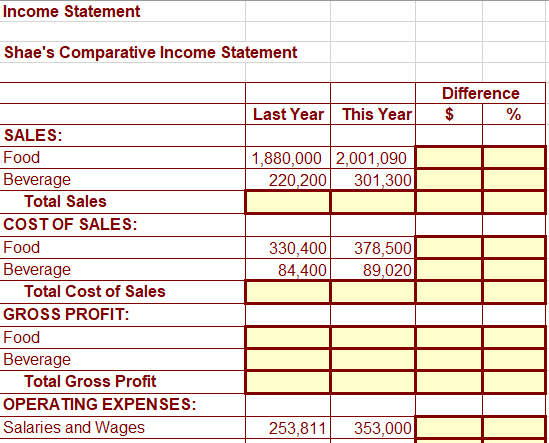
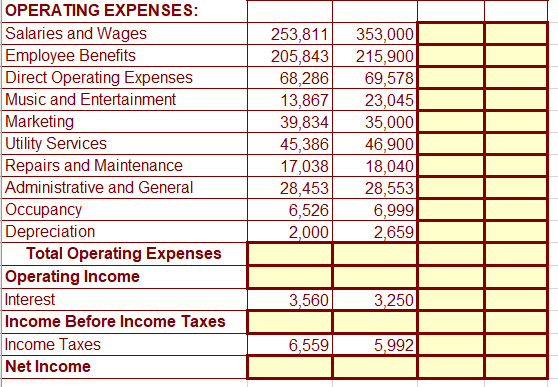
Income Statement Shae's Comparative Income Statement Difference $ % Last Year This Year 1,880,000 2,001,090 220,200 301,300 330,400 84,400 378,500 89,020 SALES: Food Beverage Total Sales COST OF SALES: Food Beverage Total Cost of Sales GROSS PROFIT: Food Beverage Total Gross Profit OPERATING EXPENSES: Salaries and Wages 253,811 353,000 OPERATING EXPENSES: Salaries and Wages Employee Benefits Direct Operating Expenses Music and Entertainment Marketing Utility Services Repairs and Maintenance Administrative and General Occupancy Depreciation Total Operating Expenses Operating Income Interest Income Before Income Taxes Income Taxes Net Income 253,811 205,843 68,286 13,867 39,834 45,386 17,038 28,453 6,526 2,000 353,000 215,900 69,578 23,045 35,000 46,900 18,040 28,553 6,999 2,659 3,560 3,250 6,559 5,992
Step by Step Solution
There are 3 Steps involved in it

Get step-by-step solutions from verified subject matter experts