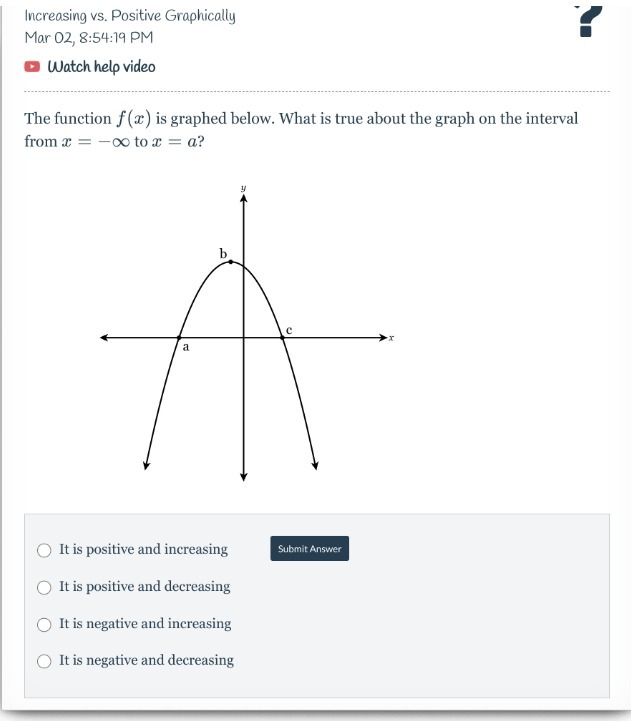
Question: Increasing vs. Positive Graphically Mar 02, 8:54:19 PM Watch help video The function f(a) is graphed below. What is true about the graph on the

Increasing vs. Positive Graphically Mar 02,
Increasing vs. Positive Graphically Mar 02, 8:54:19 PM Watch help video The function f(a) is graphed below. What is true about the graph on the interval from * = -co to c = a? b a It is positive and increasing Submit Answer It is positive and decreasing It is negative and increasing O It is negative and decreasing

Step by Step Solution

There are 3 Steps involved in it

1 Expert Approved Answer
Step: 1 Unlock blur-text-image
Question Has Been Solved by an Expert!

Get step-by-step solutions from verified subject matter experts

Step: 2 Unlock
Step: 3 Unlock

Students Have Also Explored These Related Mathematics Questions!