

Question: Independent Samples T-Test 95% Confidence Interval Statistic df P Mean difference SE difference Lower Upper Effect Size PHQ9_total Student's t 1.049 260 0.295 0.973
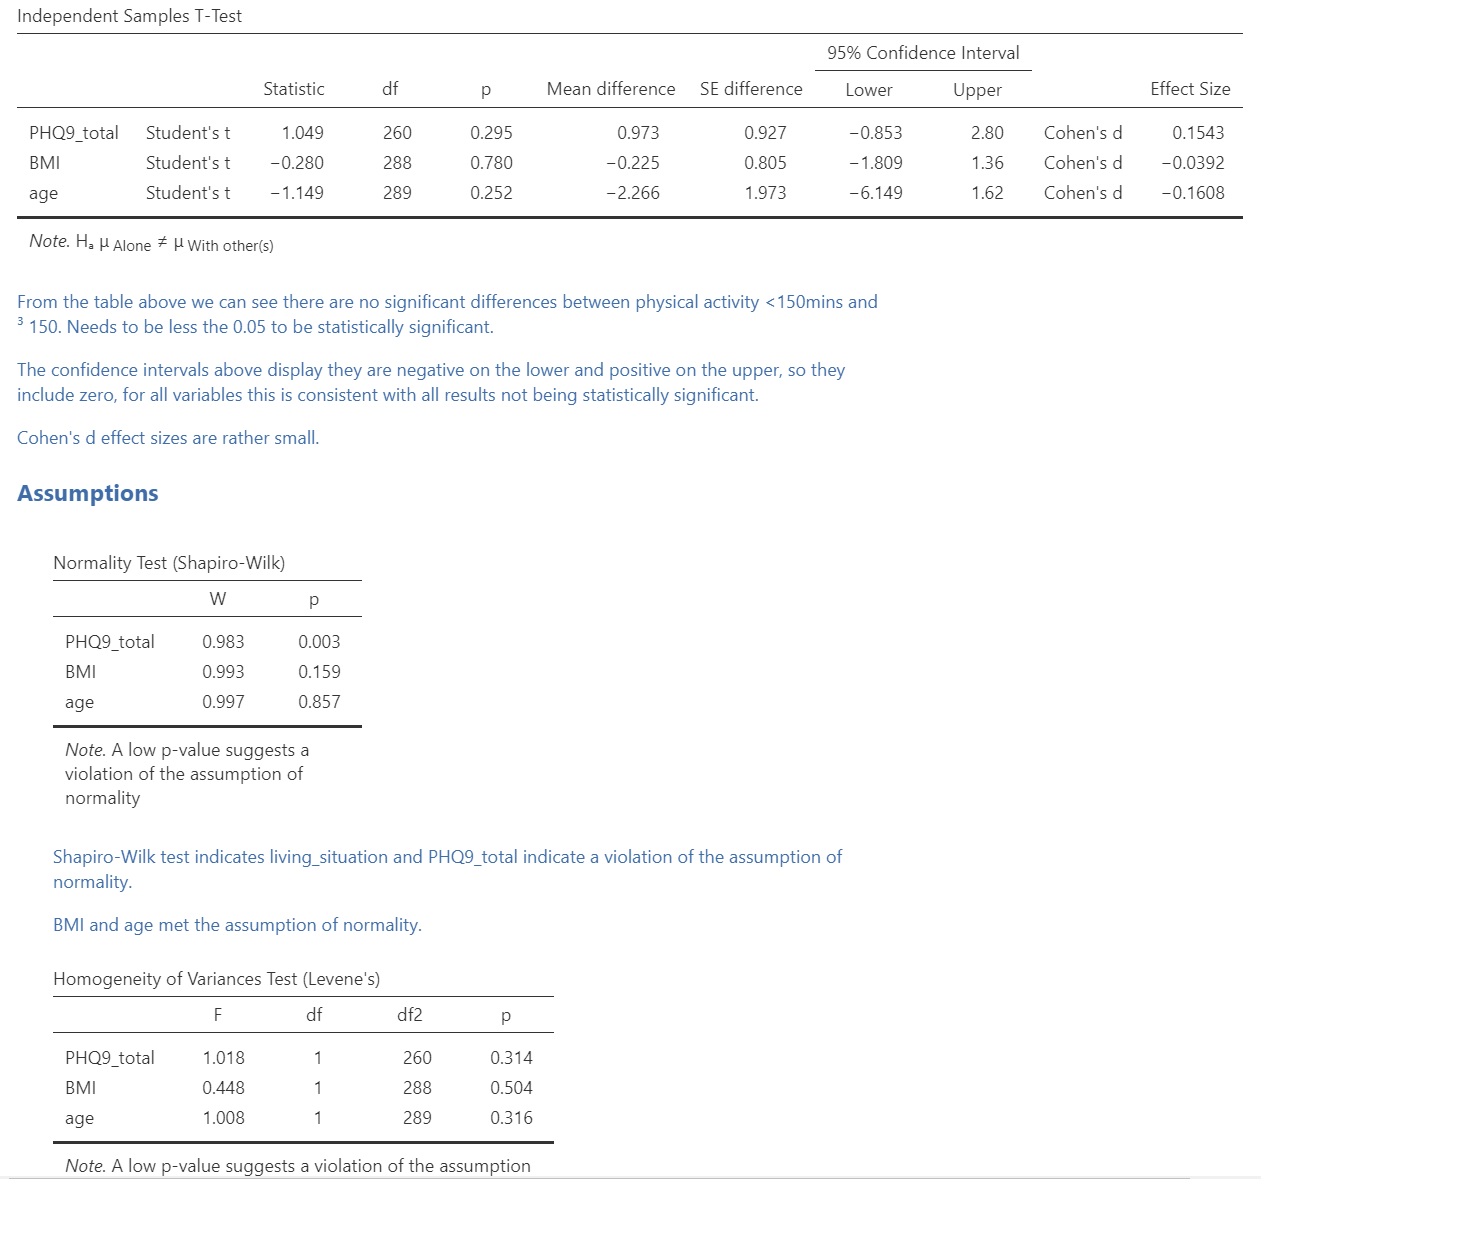
Independent Samples T-Test 95% Confidence Interval Statistic df P Mean difference SE difference Lower Upper Effect Size PHQ9_total Student's t 1.049 260 0.295 0.973 0.927 -0.853 2.80 Cohen's d 0.1543 BMI age Student's t -0.280 Student's t -1.149 288 0.780 -0.225 0.805 -1.809 1.36 Cohen's d -0.0392 289 0.252 -2.266 1.973 -6.149 1.62 Cohen's d -0.1608 Note. Ha Alone With other(s) From the table above we can see there are no significant differences between physical activity
Step by Step Solution
There are 3 Steps involved in it
1 Expert Approved Answer
Step: 1 Unlock

Question Has Been Solved by an Expert!
Get step-by-step solutions from verified subject matter experts
Step: 2 Unlock
Step: 3 Unlock