

Question: Indicate violations identified in the QC data. nd Day 1 2 3 4 5 6 7 8 9 10 11 12 13 14 15 16
Indicate violations identified in the QC data.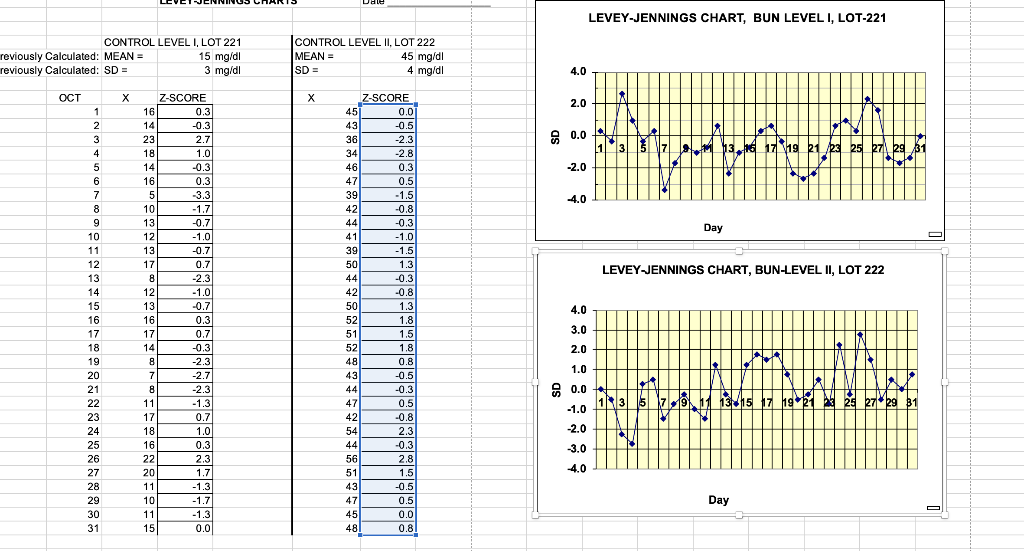 nd
nd
Day
1
2
3
4
5
6
7
8
9
10
11
12
13
14
15
16
17
18
19
20
21
22
23
24
25
26
27
28
29
30
Thank you!!!!
Jole LEVEY-JENNINGS CHART, BUN LEVEL I, LOT-221 CONTROL LEVEL I, LOT 221 reviously Calculated: MEAN = 15 mg/dl reviously Calculated: SD = 3 mg/dl CONTROL LEVEL II, LOT 222 MEAN 45 mg/dl SD = 4 mg/di 4.0 X * 2.0 19 0.0 M 3 11 17 17 19 21 23 25 27 29 31 -2.0 -4.0 Day LEVEY JENNINGS CHART, BUN-LEVEL II, LOT 222 OCT 1 2 3 4 5 6 7 8 9 10 11 12 13 14 15 16 17 18 19 20 21 22 23 24 25 26 27 28 29 30 31 Z-SCORE 16 0.3 14 -0.3 23 2.7 18 1.0 14 -0.3 16 0.3 5 3.3 10 -1.7 13 -0.7 12 -1.0 13 -0.7 17 0.7 8 -2.3 12 -1.0 13 -0.7 16 0.3 171 0.7 14 -0.3 8 -2.3 7 -2.7 8 -2.3 11 -1.3 17 0.7 18 1.0 16 0.3 22 2.3 20 1.7 11 -1.3 10 -1.7 11 -1.3 15 0.0 Z-SCORE 45] 0.01 43 -0.5 36 -2.3 34 -2.8 46 0.3 47 0.5 39 -1.5 42 -0.8 44 -0.3 41 -1.01 39 -1.5 50 1.3 44 -0.3 42 -0.8 50 1.3 52 1.8 51 1.5 52 1.8 48 0.8 43 -0.5 44 -0.3 47 0.5 42 -0.8 54 2.3 44 -0.3 56 2.8 51 1.5 43 -0.5 47 0.51 45 0.0 48 0.8 4.0 3.0 IN 2.0 14 1.0 0.0 11 -1.0NS 135 * 13 15 17 19 21 25 27 29 31 -2.0 3.0 4.0 DayStep by Step Solution
There are 3 Steps involved in it
1 Expert Approved Answer
Step: 1 Unlock

Question Has Been Solved by an Expert!
Get step-by-step solutions from verified subject matter experts
Step: 2 Unlock
Step: 3 Unlock