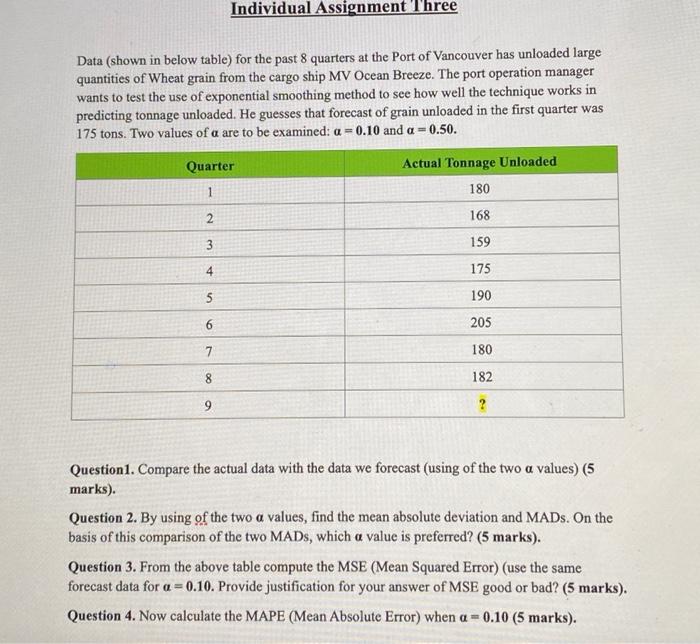
Question: Individual Assignment Three Data (shown in below table) for the past 8 quarters at the Port of Vancouver has unloaded large quantities of Wheat grain

Individual Assignment Three Data (shown in below
Individual Assignment Three Data (shown in below table) for the past 8 quarters at the Port of Vancouver has unloaded large quantities of Wheat grain from the cargo ship MV Ocean Breeze. The port operation manager wants to test the use of exponential smoothing method to see how well the technique works in predicting tonnage unloaded. He guesses that forecast of grain unloaded in the first quarter was 175 tons. Two values of a are to be examined: a = 0.10 and a = 0.50. Quarter Actual Tonnage Unloaded 1 180 2 168 3 159 4 175 5 190 6 205 7 180 8 182 9 ? Question1. Compare the actual data with the data we forecast (using of the two a values) (5 marks). Question 2. By using of the two a values, find the mean absolute deviation and MADs. On the basis of this comparison of the two MADs, which a value is preferred? (5 marks). Question 3. From the above table compute the MSE (Mean Squared Error) (use the same forecast data for a =0.10. Provide justification for your answer of MSE good or bad? (5 marks). Question 4. Now calculate the MAPE (Mean Absolute Error) when a = 0.10

Step by Step Solution

There are 3 Steps involved in it

1 Expert Approved Answer
Step: 1 Unlock blur-text-image
Question Has Been Solved by an Expert!

Get step-by-step solutions from verified subject matter experts

Step: 2 Unlock
Step: 3 Unlock

Students Have Also Explored These Related General Management Questions!