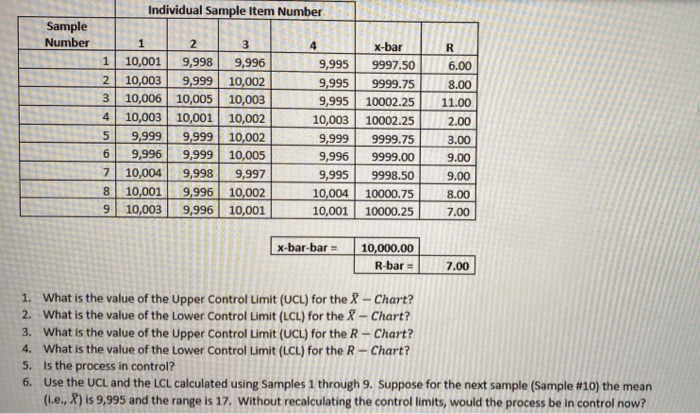
Question: Individual Sample Item Number Sample Number 1 2 3 4 x-bar 1 2 3 10,001 9,998 9,996 10,003 9,999 10,002 10,006 10,005 10,003 10,003 10,001

Individual Sample Item Number Sample Number 1 2 3
Individual Sample Item Number Sample Number 1 2 3 4 x-bar 1 2 3 10,001 9,998 9,996 10,003 9,999 10,002 10,006 10,005 10,003 10,003 10,001 10,002 9,999 9,999 10,002 9,996 9,999 10,005 10,004 9,998 9,997 10,001 9.996 10,002 10,003 9,996 10,001 til Nol o 9,995 9,995 9,995 10,003 9,999 9,996 9,995 10,004 10,001 9997.50 9999.75 10002.25 10002.25 9999.75 9999.00 R 6.00 8.00 11.00 2.00 3.00 9.00 9.00 8.00 7.00 9998.50 10000.75 10000.25 x-bar-bar = 10,000.00 R-bar = 7.00 1. What is the value of the Upper Control Limit (UCL) for the X-Chart? 2. What is the value of the Lower Control Limit (LCL) for the X-Chart? 3. What is the value of the Upper Control Limit (UCL) for the R- Chart? 4. What is the value of the Lower Control Limit (LCL) for the R-Chart? 5. Is the process in control? 6. Use the UCL and the LCL calculated using Samples 1 through 9. Suppose for the next sample (Sample #10) the mean (.e., X) is 9,995 and the range is 17. Without recalculating the control limits, would the process be in control now

Step by Step Solution

There are 3 Steps involved in it

1 Expert Approved Answer
Step: 1 Unlock blur-text-image
Question Has Been Solved by an Expert!

Get step-by-step solutions from verified subject matter experts

Step: 2 Unlock
Step: 3 Unlock

Students Have Also Explored These Related General Management Questions!