

Industria de Diseo Textil, S.A. (commonly known as Inditex) is a global retailing specialist (headquarted in...
Fantastic news! We've Found the answer you've been seeking!
Question:

Transcribed Image Text:
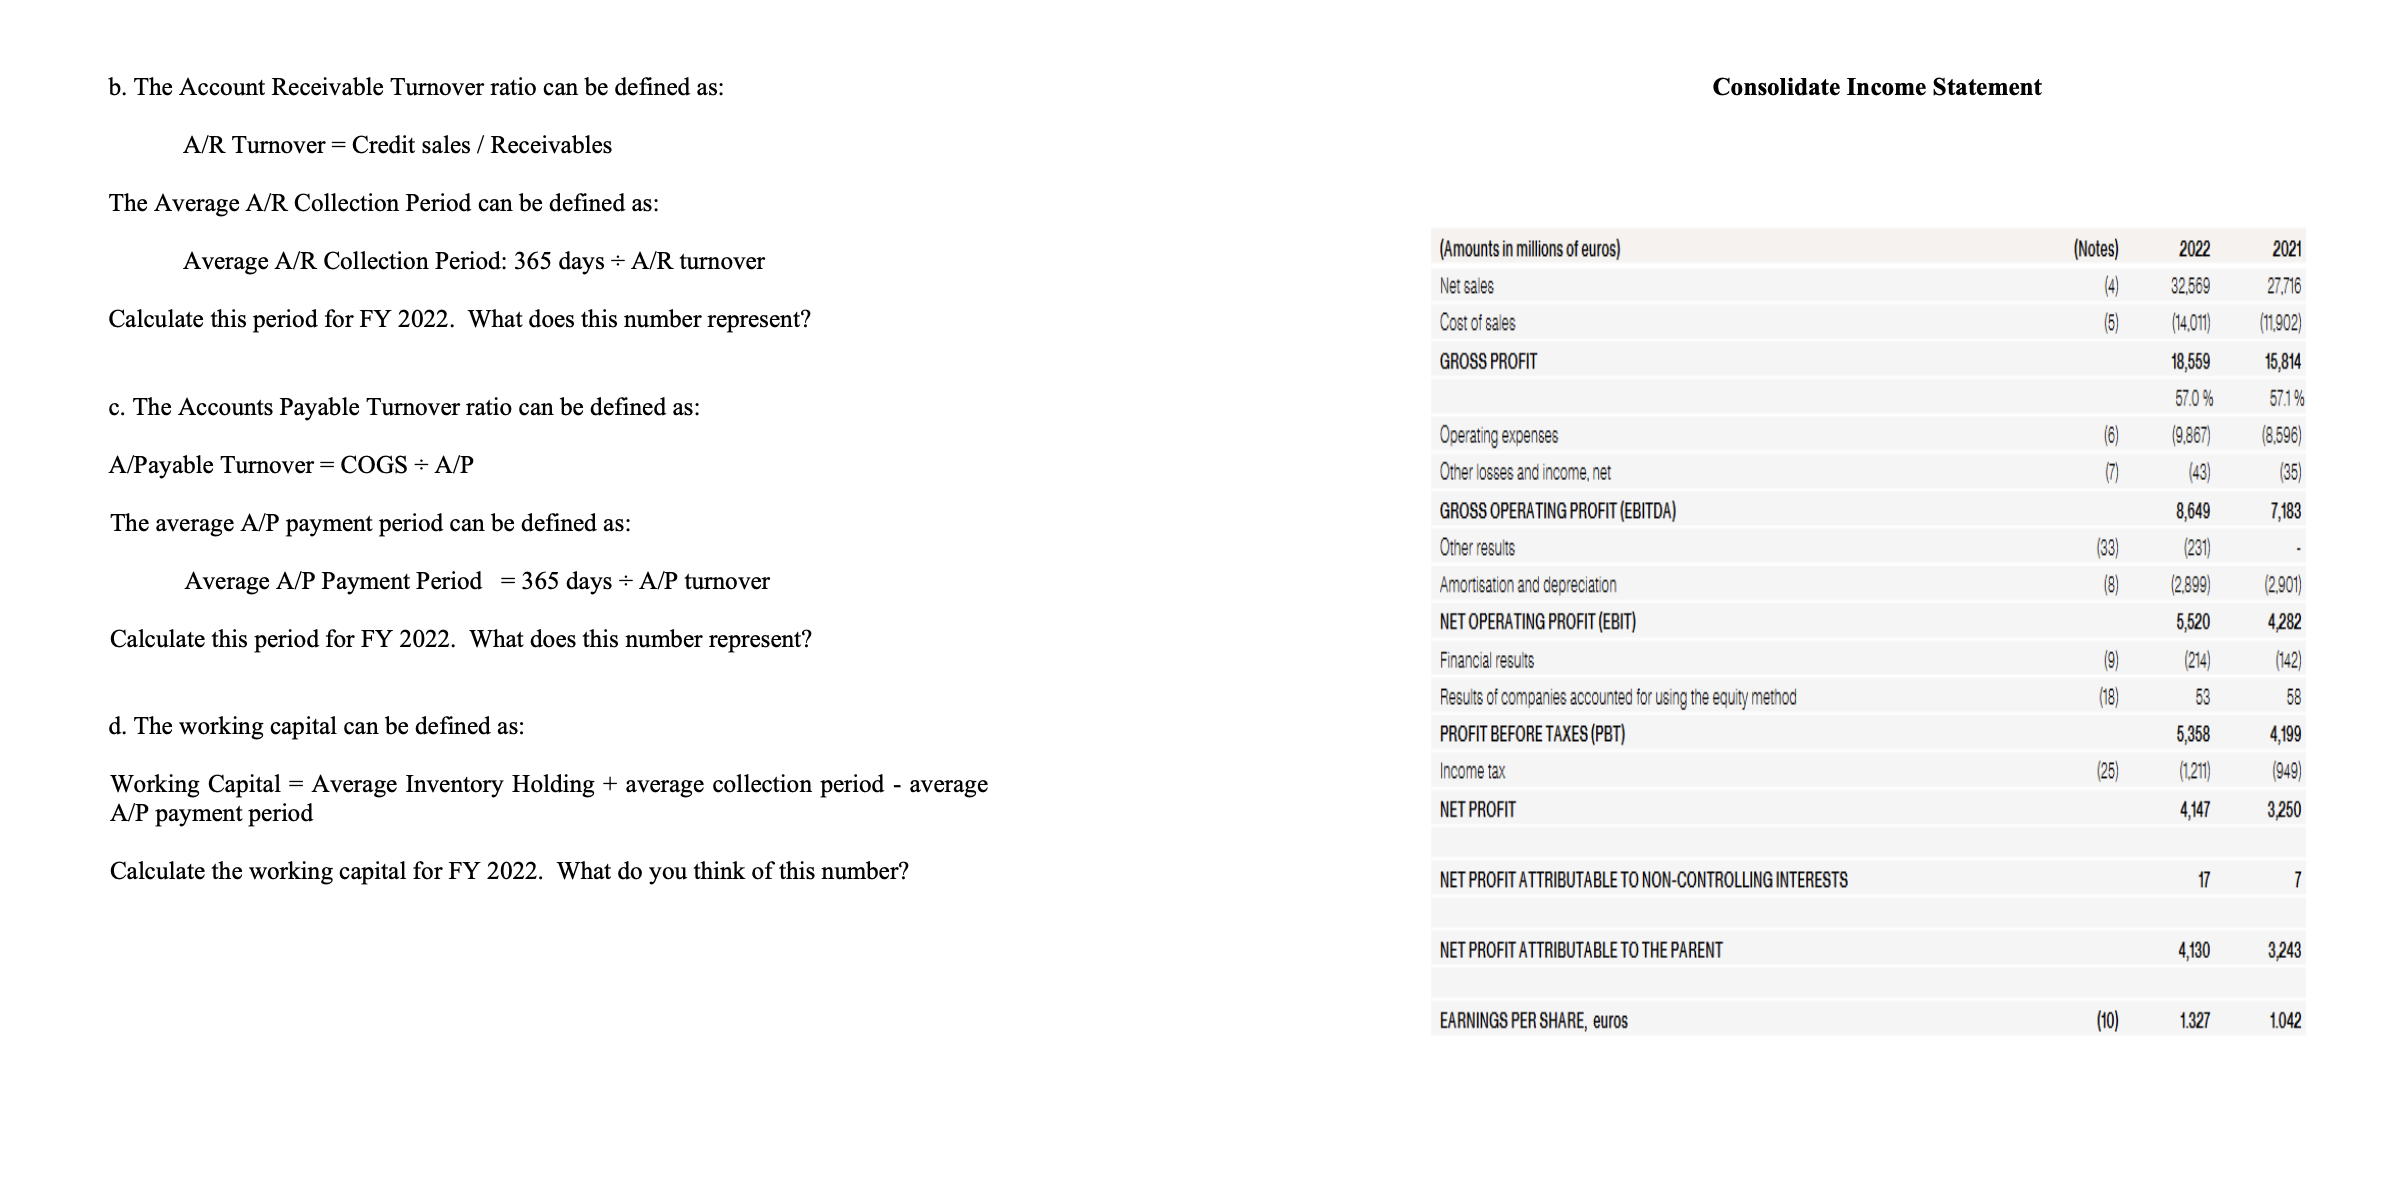
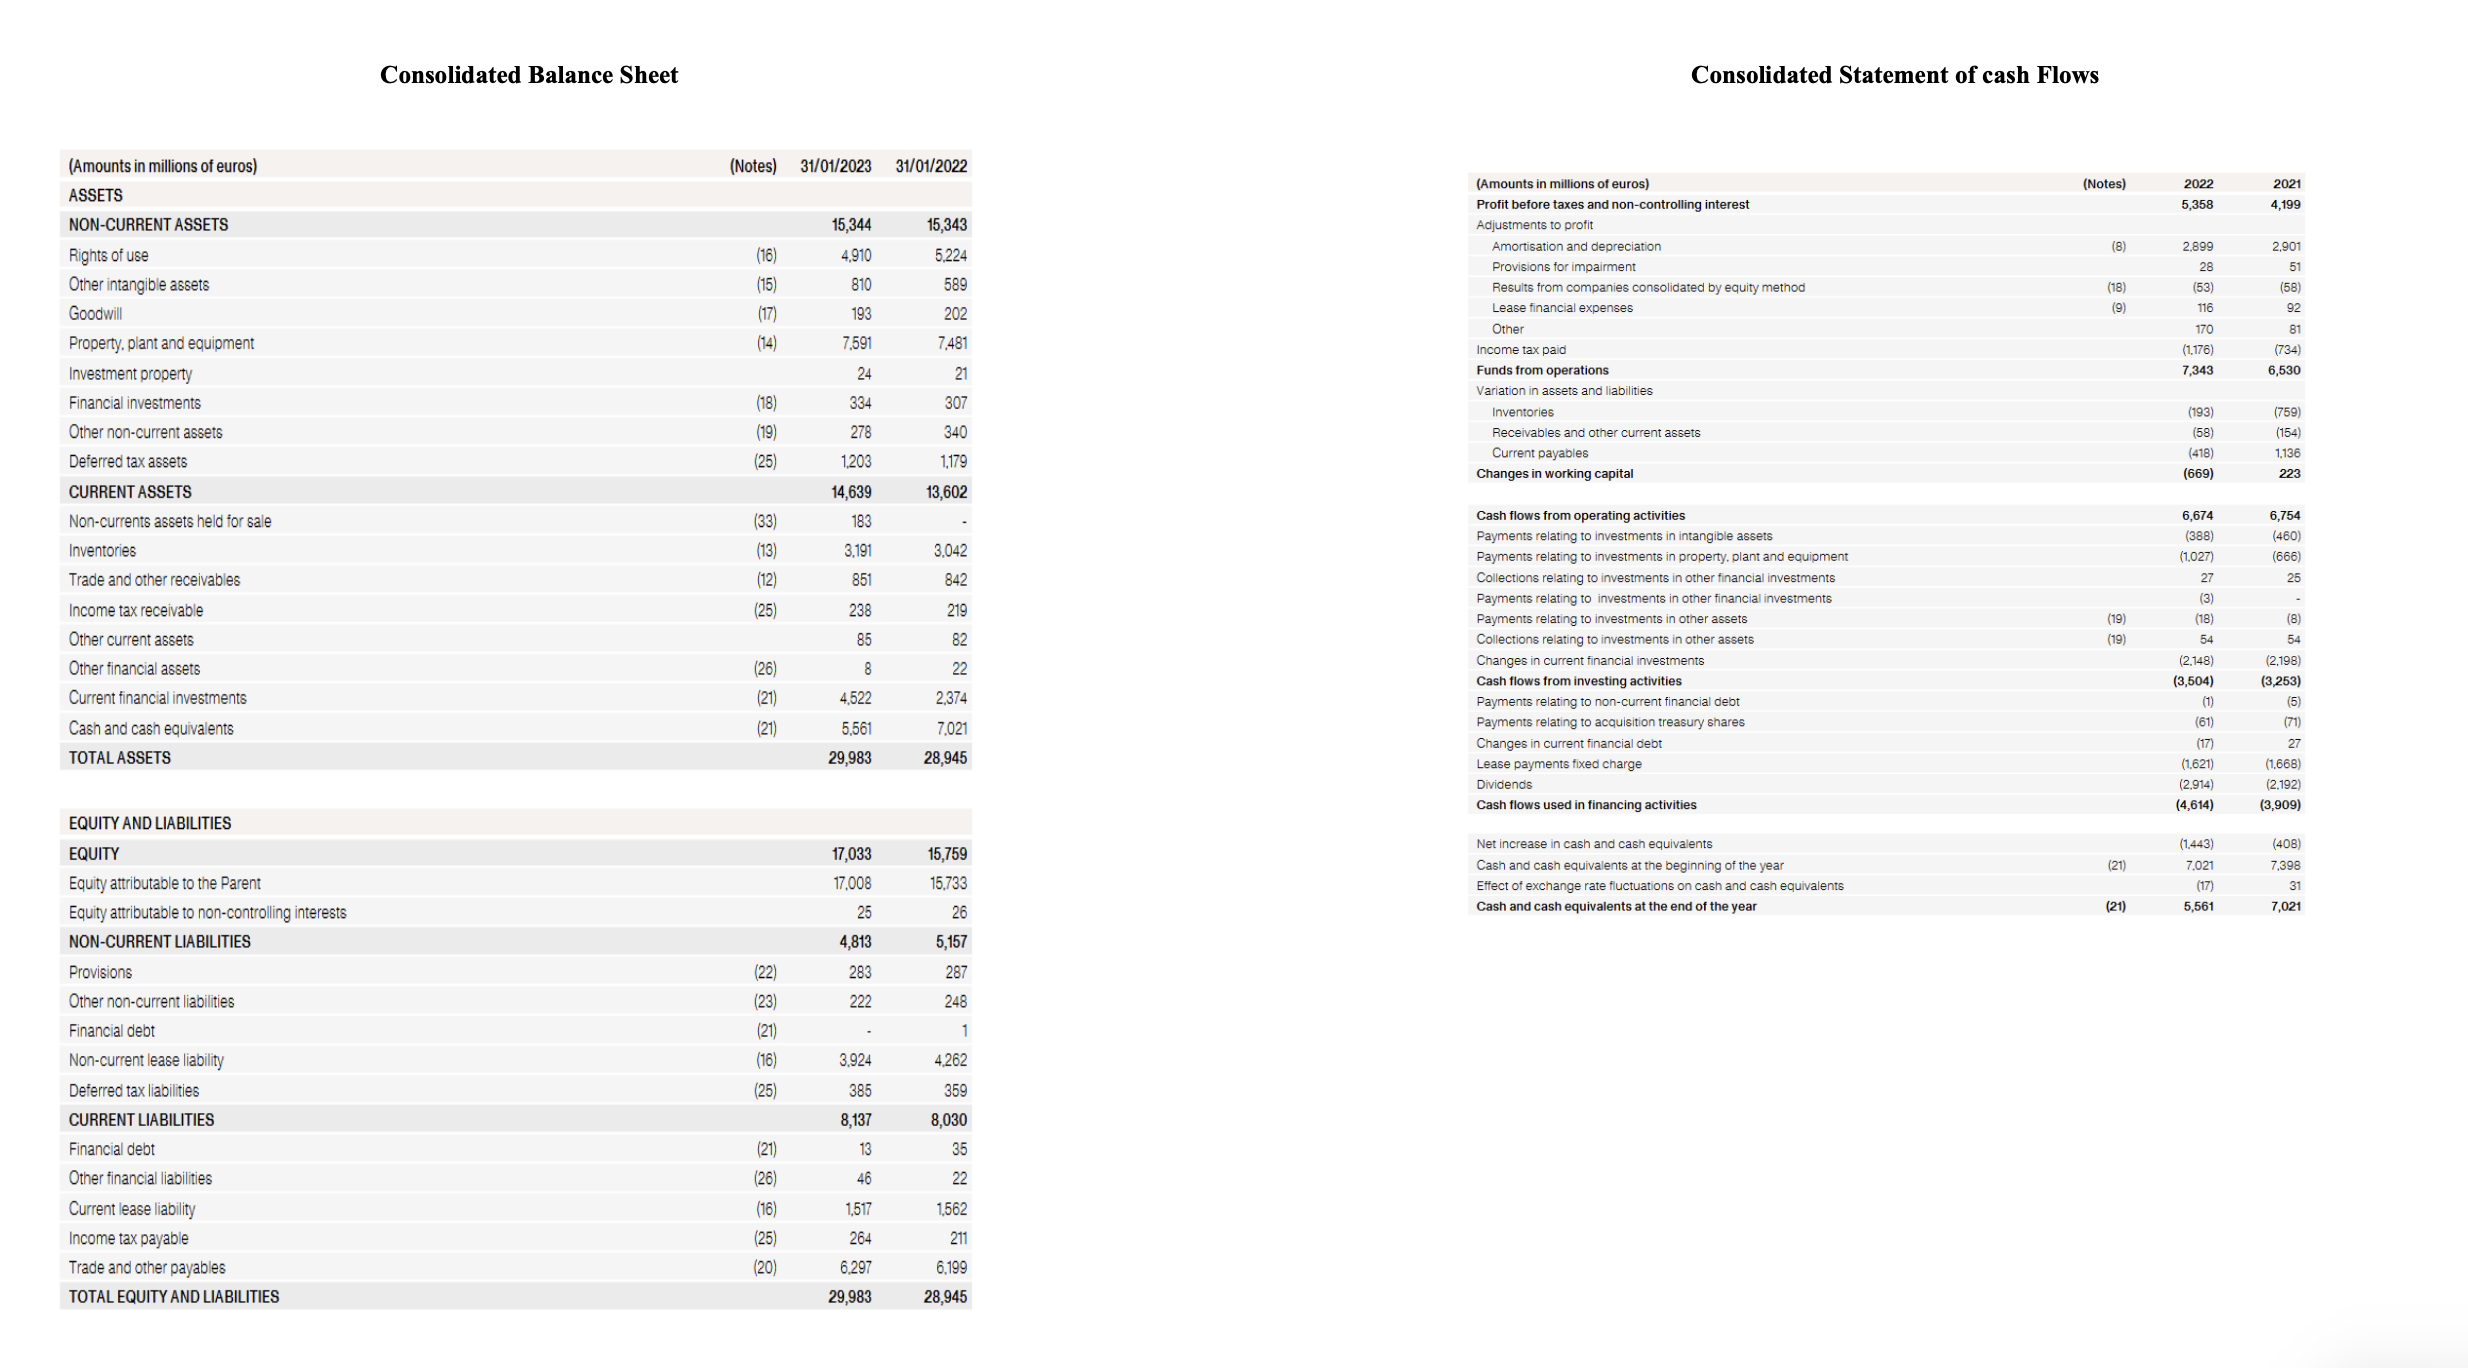
Industria de Diseo Textil, S.A. (commonly known as "Inditex") is a global retailing specialist (headquarted in Spain). Inditex is the biggest fashion group in the world and operates over 7,000 stores in 88 markets worldwide. The company's flagship store is Zara, but it also owns several other chains. Inditex operates an extremely efficient supply chains that allows the company to have a new garment going from design and production to store shelves in as little as 15 days. 1. QUESTIONS In 2022, which individual line item consumed the most cash per the Statement of Cash Flows? 2. Where did the company obtain the cash to pay for the item identified in 1. above? 3. Why is depreciation and amortization added back to income before taxes when calculating cash from operations? 4. 5. 6. 7. Review the sub-section titled Variation in Assets and Liabilities within the Statement of Cash Flows. a. Why was the amount coming under Inventories subtracted in 2022? b. Note that the signs of the adjustments flip from 2021 to 2022 for the individual line items listed as Current Payables. Explain what happened. What about the Receivables? Where on the Statement of Cash Flows can one find information about the cash necessary to open new outlets? Does this represent the full amount of PPE acquisition? a. What was the cash dividend paid in FY 2021 and FY 2022? What was the percentage of net income paid as dividend? b. What do you think of the Inditex strategy? What are the risks and rewards of these important managerial decisions considered jointly? a. The inventory turnover ratio can be defined as: Inventory turnover COGS + Average Inventory b. The Account Receivable Turnover ratio can be defined as: A/R Turnover = Credit sales / Receivables The Average A/R Collection Period can be defined as: Average A/R Collection Period: 365 days A/R turnover Calculate this period for FY 2022. What does this number represent? (Amounts in millions of euros) Net sales Cost of sales GROSS PROFIT c. The Accounts Payable Turnover ratio can be defined as: A/Payable Turnover = COGS A/P The average A/P payment period can be defined as: Average A/P Payment Period == = 365 days A/P turnover Calculate this period for FY 2022. What does this number represent? d. The working capital can be defined as: Working Capital = Average Inventory Holding + average collection period - average A/P payment period Calculate the working capital for FY 2022. What do you think of this number? Consolidate Income Statement (Notes) 2022 2021 32,569 27,716 (5) (14,011) (11,902) 18,559 15,814 57.0% 57.1% Operating expenses (6) (9,867) (8,596) Other losses and income, net (7) (43) (35) GROSS OPERATING PROFIT (EBITDA) 8,649 7,183 Other results (33) (231) Amortisation and depreciation (8) (2,899) (2,901) NET OPERATING PROFIT (EBIT) 5,520 4,282 Financial results (9) (214) (142) Results of companies accounted for using the equity method (18) 53 58 PROFIT BEFORE TAXES (PBT) 5,358 4,199 Income tax (25) (1,211) (949) NET PROFIT 4,147 3,250 NET PROFIT ATTRIBUTABLE TO NON-CONTROLLING INTERESTS NET PROFIT ATTRIBUTABLE TO THE PARENT EARNINGS PER SHARE, euros 17 7 4,130 3,243 (10) 1.327 1.042 (Amounts in millions of euros) Consolidated Balance Sheet (Notes) 31/01/2023 31/01/2022 ASSETS NON-CURRENT ASSETS 15,344 15,343 Rights of use (16) 4,910 5,224 Other intangible assets (15) 810 589 Goodwill (17) 193 202 Property, plant and equipment (14) 7,591 7,481 Investment property 24 21 Financial investments (18) 334 307 Other non-current assets (19) 278 340 Deferred tax assets (25) 1,203 1,179 CURRENT ASSETS 14,639 13,602 Non-currents assets held for sale (33) 183 Inventories (13) 3,191 3,042 Trade and other receivables (12) 851 842 Income tax receivable (25) 238 219 Other current assets 85 82 Other financial assets (26) 8 22 Current financial investments (21) 4,522 2,374 Cash and cash equivalents (21) 5,561 7.021 TOTAL ASSETS 29,983 28,945 EQUITY AND LIABILITIES EQUITY Equity attributable to the Parent Equity attributable to non-controlling interests NON-CURRENT LIABILITIES Provisions Other non-current liabilities 17,033 15,759 17,008 15,733 25 26 4,813 5,157 (22) 283 287 (23) 222 248 Financial debt Non-current lease liability Deferred tax liabilities CURRENT LIABILITIES Financial debt Other financial liabilities Current lease liability (21) 1 (16) 3,924 4,262 (25) 385 359 8,137 8,030 (21) 13 35 (26) 46 22 (16) 1,517 1,562 Income tax payable (25) 264 211 Trade and other payables (20) 6,297 6,199 TOTAL EQUITY AND LIABILITIES 29,983 28,945 (Amounts in millions of euros) Consolidated Statement of cash Flows Profit before taxes and non-controlling interest (Notes) 2022 2021 5,358 4,199 Other Income tax paid Funds from operations Variation in assets and liabilities Inventories Receivables and other current assets Current payables Changes in working capital Cash flows from operating activities Payments relating to investments in intangible assets Payments relating to investments in property, plant and equipment Collections relating to investments in other financial investments Payments relating to investments in other financial investments Payments relating to investments in other assets Collections relating to investments in other assets Changes in current financial investments Cash flows from investing activities Payments relating to non-current financial debt Payments relating to acquisition treasury shares Changes in current financial debt Lease payments fixed charge Dividends Cash flows used in financing activities Adjustments to profit Amortisation and depreciation (8) 2,899 2,901 Provisions for impairment 28 51 Results from companies consolidated by equity method (18) (53) (58) Lease financial expenses (9) 116 92 170 81 (1.176) (734) 7,343 6,530 (193) (759) (58) (154) (418) 1,136 (669) 223 6,674 6,754 (388) (460) (1,027) (666) 27 25 (3) - (19) (18) (8) (19) 54 54 (2.148) (2,198) (3,504) (3,253) (1) (5) (61) (71) (17) 27 (1.621) (1.668) (2,914) (2.192) (4,614) (3,909) Net increase in cash and cash equivalents (1,443) (408) Cash and cash equivalents at the beginning of the year (21) 7.021 7,398 Effect of exchange rate fluctuations on cash and cash equivalents Cash and cash equivalents at the end of the year (17) 31 (21) 5,561 7,021 Industria de Diseo Textil, S.A. (commonly known as "Inditex") is a global retailing specialist (headquarted in Spain). Inditex is the biggest fashion group in the world and operates over 7,000 stores in 88 markets worldwide. The company's flagship store is Zara, but it also owns several other chains. Inditex operates an extremely efficient supply chains that allows the company to have a new garment going from design and production to store shelves in as little as 15 days. 1. QUESTIONS In 2022, which individual line item consumed the most cash per the Statement of Cash Flows? 2. Where did the company obtain the cash to pay for the item identified in 1. above? 3. Why is depreciation and amortization added back to income before taxes when calculating cash from operations? 4. 5. 6. 7. Review the sub-section titled Variation in Assets and Liabilities within the Statement of Cash Flows. a. Why was the amount coming under Inventories subtracted in 2022? b. Note that the signs of the adjustments flip from 2021 to 2022 for the individual line items listed as Current Payables. Explain what happened. What about the Receivables? Where on the Statement of Cash Flows can one find information about the cash necessary to open new outlets? Does this represent the full amount of PPE acquisition? a. What was the cash dividend paid in FY 2021 and FY 2022? What was the percentage of net income paid as dividend? b. What do you think of the Inditex strategy? What are the risks and rewards of these important managerial decisions considered jointly? a. The inventory turnover ratio can be defined as: Inventory turnover COGS + Average Inventory b. The Account Receivable Turnover ratio can be defined as: A/R Turnover = Credit sales / Receivables The Average A/R Collection Period can be defined as: Average A/R Collection Period: 365 days A/R turnover Calculate this period for FY 2022. What does this number represent? (Amounts in millions of euros) Net sales Cost of sales GROSS PROFIT c. The Accounts Payable Turnover ratio can be defined as: A/Payable Turnover = COGS A/P The average A/P payment period can be defined as: Average A/P Payment Period == = 365 days A/P turnover Calculate this period for FY 2022. What does this number represent? d. The working capital can be defined as: Working Capital = Average Inventory Holding + average collection period - average A/P payment period Calculate the working capital for FY 2022. What do you think of this number? Consolidate Income Statement (Notes) 2022 2021 32,569 27,716 (5) (14,011) (11,902) 18,559 15,814 57.0% 57.1% Operating expenses (6) (9,867) (8,596) Other losses and income, net (7) (43) (35) GROSS OPERATING PROFIT (EBITDA) 8,649 7,183 Other results (33) (231) Amortisation and depreciation (8) (2,899) (2,901) NET OPERATING PROFIT (EBIT) 5,520 4,282 Financial results (9) (214) (142) Results of companies accounted for using the equity method (18) 53 58 PROFIT BEFORE TAXES (PBT) 5,358 4,199 Income tax (25) (1,211) (949) NET PROFIT 4,147 3,250 NET PROFIT ATTRIBUTABLE TO NON-CONTROLLING INTERESTS NET PROFIT ATTRIBUTABLE TO THE PARENT EARNINGS PER SHARE, euros 17 7 4,130 3,243 (10) 1.327 1.042 (Amounts in millions of euros) Consolidated Balance Sheet (Notes) 31/01/2023 31/01/2022 ASSETS NON-CURRENT ASSETS 15,344 15,343 Rights of use (16) 4,910 5,224 Other intangible assets (15) 810 589 Goodwill (17) 193 202 Property, plant and equipment (14) 7,591 7,481 Investment property 24 21 Financial investments (18) 334 307 Other non-current assets (19) 278 340 Deferred tax assets (25) 1,203 1,179 CURRENT ASSETS 14,639 13,602 Non-currents assets held for sale (33) 183 Inventories (13) 3,191 3,042 Trade and other receivables (12) 851 842 Income tax receivable (25) 238 219 Other current assets 85 82 Other financial assets (26) 8 22 Current financial investments (21) 4,522 2,374 Cash and cash equivalents (21) 5,561 7.021 TOTAL ASSETS 29,983 28,945 EQUITY AND LIABILITIES EQUITY Equity attributable to the Parent Equity attributable to non-controlling interests NON-CURRENT LIABILITIES Provisions Other non-current liabilities 17,033 15,759 17,008 15,733 25 26 4,813 5,157 (22) 283 287 (23) 222 248 Financial debt Non-current lease liability Deferred tax liabilities CURRENT LIABILITIES Financial debt Other financial liabilities Current lease liability (21) 1 (16) 3,924 4,262 (25) 385 359 8,137 8,030 (21) 13 35 (26) 46 22 (16) 1,517 1,562 Income tax payable (25) 264 211 Trade and other payables (20) 6,297 6,199 TOTAL EQUITY AND LIABILITIES 29,983 28,945 (Amounts in millions of euros) Consolidated Statement of cash Flows Profit before taxes and non-controlling interest (Notes) 2022 2021 5,358 4,199 Other Income tax paid Funds from operations Variation in assets and liabilities Inventories Receivables and other current assets Current payables Changes in working capital Cash flows from operating activities Payments relating to investments in intangible assets Payments relating to investments in property, plant and equipment Collections relating to investments in other financial investments Payments relating to investments in other financial investments Payments relating to investments in other assets Collections relating to investments in other assets Changes in current financial investments Cash flows from investing activities Payments relating to non-current financial debt Payments relating to acquisition treasury shares Changes in current financial debt Lease payments fixed charge Dividends Cash flows used in financing activities Adjustments to profit Amortisation and depreciation (8) 2,899 2,901 Provisions for impairment 28 51 Results from companies consolidated by equity method (18) (53) (58) Lease financial expenses (9) 116 92 170 81 (1.176) (734) 7,343 6,530 (193) (759) (58) (154) (418) 1,136 (669) 223 6,674 6,754 (388) (460) (1,027) (666) 27 25 (3) - (19) (18) (8) (19) 54 54 (2.148) (2,198) (3,504) (3,253) (1) (5) (61) (71) (17) 27 (1.621) (1.668) (2,914) (2.192) (4,614) (3,909) Net increase in cash and cash equivalents (1,443) (408) Cash and cash equivalents at the beginning of the year (21) 7.021 7,398 Effect of exchange rate fluctuations on cash and cash equivalents Cash and cash equivalents at the end of the year (17) 31 (21) 5,561 7,021
Expert Answer:

Related Book For 
Operations Management
ISBN: 9780273708476
5th Edition
Authors: Nigel Slack, Stuart Chambers, Robert Johnston
Posted Date:
Students also viewed these finance questions
-
Managing Scope Changes Case Study Scope changes on a project can occur regardless of how well the project is planned or executed. Scope changes can be the result of something that was omitted during...
-
Read the case study "Southwest Airlines," found in Part 2 of your textbook. Review the "Guide to Case Analysis" found on pp. CA1 - CA11 of your textbook. (This guide follows the last case in the...
-
Graph the solution of each system given in Problems 5-18. \(\left\{\begin{array}{l}x \geq 0 \\ y \geq 0 \\ x <500 \\ y \leq 1,000\end{array}ight.\)
-
Gambling on Sporting Events: Some people gamble on sporting events strictly to make money while others care directly about which teams win quite apart from whether or not they gambled on the game. A....
-
Plastique produces parts for use in various industries. Plastique uses a job-costing system. The nature of its process is such that management expects normal spoilage at a rate of 2% of good parts....
-
Briefly discuss the auditing implications of using computer service centers.
-
Consider again the kitty litter ordering policy for Sams Cat Hotel in Problem 7. a. Suppose that the weekly demand forecast of 90 bags is incorrect and actual demand averages only 60 bags per week....
-
Write a PowerPoint slide presentation about this ERD diagram . Project name is "Small community College" . Grade id Student_id Name Dept Type Department id Department Belongs To Name Address...
-
Abernathy Company's accounting department has finished preparing the master budget for this year. The chief financial officer (CFO) would like your assistance in creating data visualizations that she...
-
Leslie repeats a unique sound, known as a __________when she engages in meditation.
-
What are the functions of emotions?
-
Many people enjoy watching movies, sporting events, and music performances in crowded theaters and arenas more than they like watching them at home alone. Which theory of emotions may help explain...
-
Dreams most often occur in __________sleep.
-
Focusing on one of the five major perspectives in use today (that is, neuroscience, psychodynamic, behavioral, cognitive, and humanistic), can you describe the kinds of research questions and studies...
-
Calculate a table of interest rates based on the following information: The pure interest rate is 2.5% Inflation expectations for year 1 = 2%, year 2 =4%, years 3-5 =5% The default risk is .1% for...
-
An Atomic Energy Commission nuclear facility was established in Hanford, Washington, in 1943. Over the years, a significant amount of strontium 90 and cesium 137 leaked into the Columbia River. In a...
-
Consider the multiple linear regression model fit to the baseball data in Problem 3.41. Problem 3.41 Consider the 2016 major league baseball data in Table B.22. While team ERA was useful in...
-
Consider the simple linear regression model fit to the rental price data from Problem 2.36. Data From Problem 2.36 Table B.24 contains data on median family home rental price and other data for 51 US...
-
Consider the multiple linear regression model fit to the rental price data in Problem 3.42. Problem 3.42 Table B.24 contains data on median family home rental price and other data for 51 US cities....

Study smarter with the SolutionInn App