

Question: industrial Eng 6. A manufacturing process is being controlled with a chart for proportion nonconforming. The number of nonconforming items determined in each randomly selected
industrial Eng 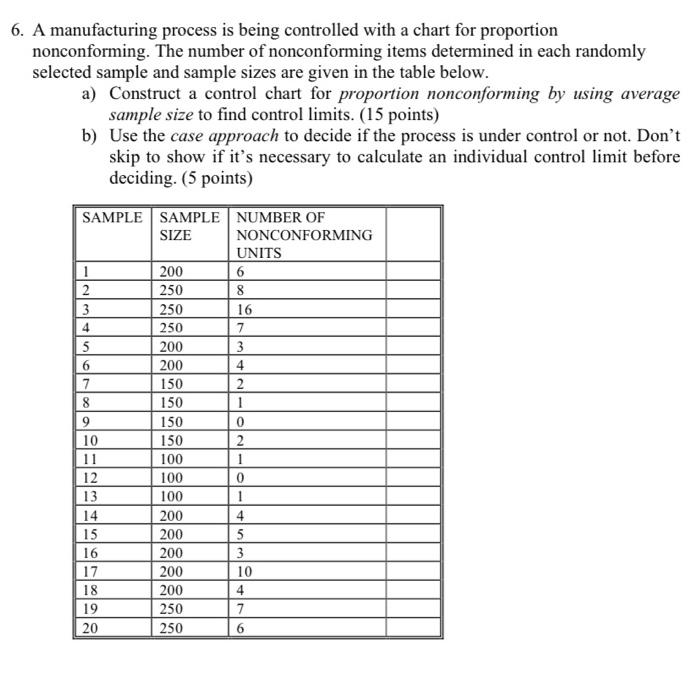
6. A manufacturing process is being controlled with a chart for proportion nonconforming. The number of nonconforming items determined in each randomly selected sample and sample sizes are given in the table below. a) Construct a control chart for proportion nonconforming by using average sample size to find control limits. (15 points) b) Use the case approach to decide if the process is under control or not. Don't skip to show if it's necessary to calculate an individual control limit before deciding. (5 points) SAMPLE SAMPLE NUMBER OF SIZE NONCONFORMING UNITS 1 200 6 2 250 8 3 250 16 250 7 200 3 6 200 4 7 150 2 8 150 1 9 150 0 10 150 2 11 100 1 12 100 0 13 100 1 14 200 4 15 200 5 16 200 3 17 200 10 18 200 4 19 250 7 20 250 6 la
Step by Step Solution
There are 3 Steps involved in it
1 Expert Approved Answer
Step: 1 Unlock

Question Has Been Solved by an Expert!
Get step-by-step solutions from verified subject matter experts
Step: 2 Unlock
Step: 3 Unlock