

Question: INDUSTRY AVERAGE RATIO Current ratio 1.65 x Average collection period 160 Days Quick ratio 1.32 x Inventory turnover 1.30 x Debt ratio 40% Return on
INDUSTRY AVERAGE RATIO
| Current ratio | 1.65 x | Average collection period | 160 Days |
| Quick ratio | 1.32 x | Inventory turnover | 1.30 x |
| Debt ratio | 40% | Return on assets | 9.56% |
| Time interest earned | 7.9 x | Net profit margin | 22% |
Analyze financial report for chosen company and state the condition of the company. Your analysis must consists all ratio analysis for year 2019
- Evaluate each major category of the below financial ratios.
- Solvency Ratio
- Operating Performance Ratio
- Risk Analysis
- Growth Analysis
- Interpret and conclude your analysis and elaborate if you are going to invest in the company. Suggest any recommendation to the company to improve on the current position of the company.
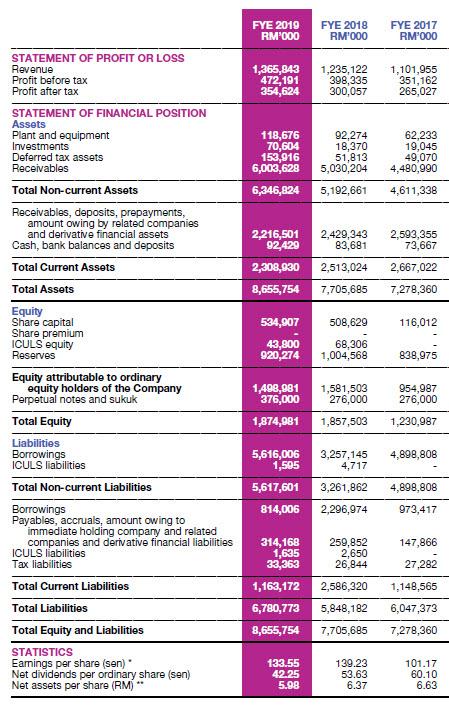
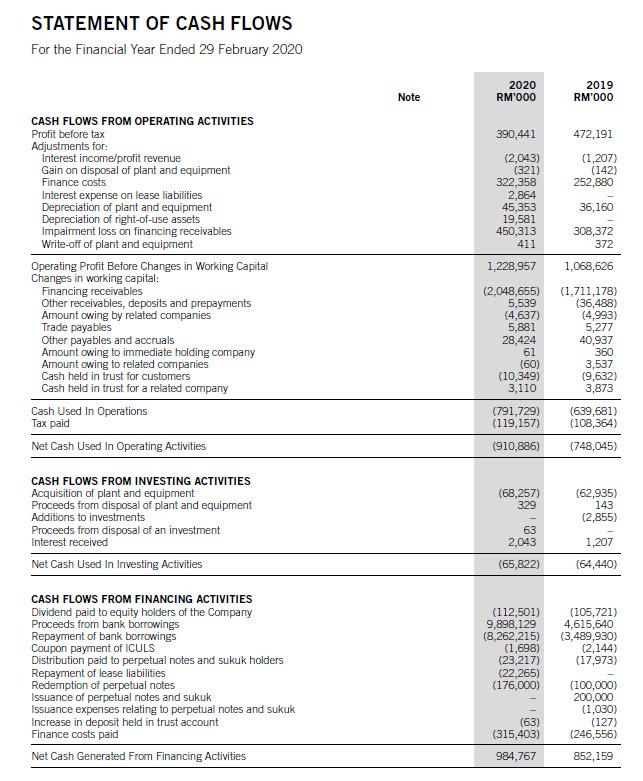
FE 2019 RM'000 EYE 2018 RM'000 EYE 2017 RM'000 1,365,843 472,191 354,624 1,235,122 398,335 300,057 1,101,955 351,162 265,027 118,676 70,604 153,916 6,003,628 92,274 18,370 51,813 5,030,204 62,233 19,045 49,070 4,480,990 4,611,338 6,346,824 5,192,661 2,593,355 73,667 2,216,501 92,429 2,308,830 8,655,754 2,429,343 83,681 2,513,024 2,667,022 7,278,360 7,705,685 534,907 508,629 116,012 43,800 920,274 68,306 1,004,568 838,975 STATEMENT OF PROFIT OR LOSS Revenue Profit before tax Profit after tax STATEMENT OF FINANCIAL POSITION Assets Plant and equipment Investments Deferred tax assets Receivables Total Non-current Assets Receivables, deposits, prepayments, amount owing by related companies and derivative financial assets Cash, bank balances and deposits Total Current Assets Total Assets Equity Share capital Share premium ICULS equity Reserves Equity attributable to ordinary equity holders of the Company Perpetual notes and sukuk Total Equity Liabilities Borrowings ICULS liabilities Total Non-current Liabilities Borrowings Payables, accruals, amount owing to immediate holding company and related companies and derivative financial liabilities ICULS liabilities Tax liabilities Total Current Liabilities Total Liabilities Total Equity and Liabilities STATISTICS Earnings per share (sen) Net dividends per ordinary share (sen) Net assets per share (RM) 1,498,981 376,000 1,581,503 276,000 954,987 276,000 1,874,981 1,857,503 1,230,987 3,257,145 4,717 4,898,808 5,616,006 1,505 5,617,601 814,006 3,261,862 4,898,808 2,296,974 973,417 259,852 2,650 26,844 147,866 27,282 314,168 1,635 33,363 1,163,172 6,780,773 8,655,754 2,586,320 1,148,565 5,848,182 6,047,373 7,278,360 7,705,685 133.55 42.25 5.98 139.23 53.63 6.37 101.17 60.10 6.63 de STATEMENT OF CASH FLOWS For the Financial Year Ended 29 February 2020 Note 2020 RM'000 2019 RM'000 390,441 472,191 (1,207) (142) 252.880 (2,043) (321) 322,358 2,864 45,353 19,581 450,313 411 36,160 308,372 372 1,228,957 1,068,626 CASH FLOWS FROM OPERATING ACTIVITIES Profit before tax Adjustments for: Interest income/profit revenue Gain on disposal of plant and equipment Finance costs Interest expense on lease liabilities Depreciation of plant and equipment Depreciation of right-of-use assets Impairment loss on financing receivables Write-off of plant and equipment Operating Profit Before Changes in Working Capital Changes in working capital: Financing receivables Other receivables, deposits and prepayments Amount owing by related companies Trade payables Other payables and accruals Amount owing to immediate holding company Amount owing to related companies Cash held in trust for customers Cash held in trust for a related company Cash Used In Operations Tax paid Net Cash Used In Operating Activities (2,048,655) 5,539 (4,637) 5,881 28,424 61 (60) (10,349) 3,110 (1,711,178) (36,488) (4,993) 5,277 40,937 360 3,537 (9,632) 3,873 (791,729) (119,157) (639,681) (108,364) (910,886) (748,045) (68,257) 329 CASH FLOWS FROM INVESTING ACTIVITIES Acquisition of plant and equipment Proceeds from disposal of plant and equipment Additions to investments Proceeds from disposal of an investment Interest received Net Cash Used In Investing Activities (62,935) 143 (2,855) 63 2,043 (65,822) 1,207 (64,440) CASH FLOWS FROM FINANCING ACTIVITIES Dividend paid to equity holders of the Company Proceeds from bank borrowings Repayment of bank borrowings Coupon payment of ICULS Distribution paid to perpetual notes and sukuk holders Repayment of lease liabilities Redemption of perpetual notes Issuance of perpetual notes and sukuk Issuance expenses relating to perpetual notes and sukuk Increase in deposit held in trust account Finance costs paid Net Cash Generated From Financing Activities (112,501) 9,898,129 (8,262,215) (1,698) (23,217) (22,265) (176,000) (105,721) 4,615,640 (3,489,930) (2,144) (17,973) (100,000) 200,000 (1,030) (127) (246,556) (63) (315,403) 984,767 852, 159 FE 2019 RM'000 EYE 2018 RM'000 EYE 2017 RM'000 1,365,843 472,191 354,624 1,235,122 398,335 300,057 1,101,955 351,162 265,027 118,676 70,604 153,916 6,003,628 92,274 18,370 51,813 5,030,204 62,233 19,045 49,070 4,480,990 4,611,338 6,346,824 5,192,661 2,593,355 73,667 2,216,501 92,429 2,308,830 8,655,754 2,429,343 83,681 2,513,024 2,667,022 7,278,360 7,705,685 534,907 508,629 116,012 43,800 920,274 68,306 1,004,568 838,975 STATEMENT OF PROFIT OR LOSS Revenue Profit before tax Profit after tax STATEMENT OF FINANCIAL POSITION Assets Plant and equipment Investments Deferred tax assets Receivables Total Non-current Assets Receivables, deposits, prepayments, amount owing by related companies and derivative financial assets Cash, bank balances and deposits Total Current Assets Total Assets Equity Share capital Share premium ICULS equity Reserves Equity attributable to ordinary equity holders of the Company Perpetual notes and sukuk Total Equity Liabilities Borrowings ICULS liabilities Total Non-current Liabilities Borrowings Payables, accruals, amount owing to immediate holding company and related companies and derivative financial liabilities ICULS liabilities Tax liabilities Total Current Liabilities Total Liabilities Total Equity and Liabilities STATISTICS Earnings per share (sen) Net dividends per ordinary share (sen) Net assets per share (RM) 1,498,981 376,000 1,581,503 276,000 954,987 276,000 1,874,981 1,857,503 1,230,987 3,257,145 4,717 4,898,808 5,616,006 1,505 5,617,601 814,006 3,261,862 4,898,808 2,296,974 973,417 259,852 2,650 26,844 147,866 27,282 314,168 1,635 33,363 1,163,172 6,780,773 8,655,754 2,586,320 1,148,565 5,848,182 6,047,373 7,278,360 7,705,685 133.55 42.25 5.98 139.23 53.63 6.37 101.17 60.10 6.63 de STATEMENT OF CASH FLOWS For the Financial Year Ended 29 February 2020 Note 2020 RM'000 2019 RM'000 390,441 472,191 (1,207) (142) 252.880 (2,043) (321) 322,358 2,864 45,353 19,581 450,313 411 36,160 308,372 372 1,228,957 1,068,626 CASH FLOWS FROM OPERATING ACTIVITIES Profit before tax Adjustments for: Interest income/profit revenue Gain on disposal of plant and equipment Finance costs Interest expense on lease liabilities Depreciation of plant and equipment Depreciation of right-of-use assets Impairment loss on financing receivables Write-off of plant and equipment Operating Profit Before Changes in Working Capital Changes in working capital: Financing receivables Other receivables, deposits and prepayments Amount owing by related companies Trade payables Other payables and accruals Amount owing to immediate holding company Amount owing to related companies Cash held in trust for customers Cash held in trust for a related company Cash Used In Operations Tax paid Net Cash Used In Operating Activities (2,048,655) 5,539 (4,637) 5,881 28,424 61 (60) (10,349) 3,110 (1,711,178) (36,488) (4,993) 5,277 40,937 360 3,537 (9,632) 3,873 (791,729) (119,157) (639,681) (108,364) (910,886) (748,045) (68,257) 329 CASH FLOWS FROM INVESTING ACTIVITIES Acquisition of plant and equipment Proceeds from disposal of plant and equipment Additions to investments Proceeds from disposal of an investment Interest received Net Cash Used In Investing Activities (62,935) 143 (2,855) 63 2,043 (65,822) 1,207 (64,440) CASH FLOWS FROM FINANCING ACTIVITIES Dividend paid to equity holders of the Company Proceeds from bank borrowings Repayment of bank borrowings Coupon payment of ICULS Distribution paid to perpetual notes and sukuk holders Repayment of lease liabilities Redemption of perpetual notes Issuance of perpetual notes and sukuk Issuance expenses relating to perpetual notes and sukuk Increase in deposit held in trust account Finance costs paid Net Cash Generated From Financing Activities (112,501) 9,898,129 (8,262,215) (1,698) (23,217) (22,265) (176,000) (105,721) 4,615,640 (3,489,930) (2,144) (17,973) (100,000) 200,000 (1,030) (127) (246,556) (63) (315,403) 984,767 852, 159
Step by Step Solution
There are 3 Steps involved in it

Get step-by-step solutions from verified subject matter experts