

Question: Industry Average Ratios for December 31, 2021 Current 2.7% Total Asset Turnover 2.6X Return on Assets 9.1% Quick 1.OX Debt Ratio 50% Return on Equity
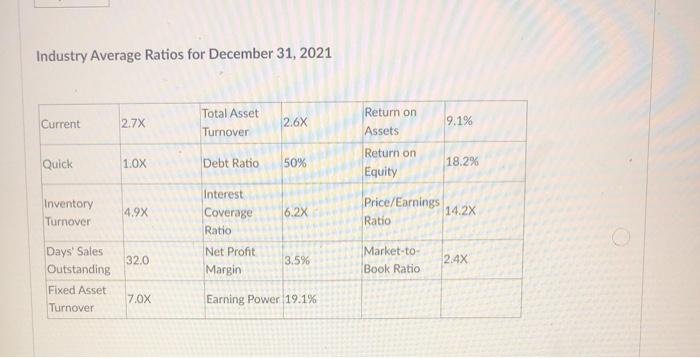
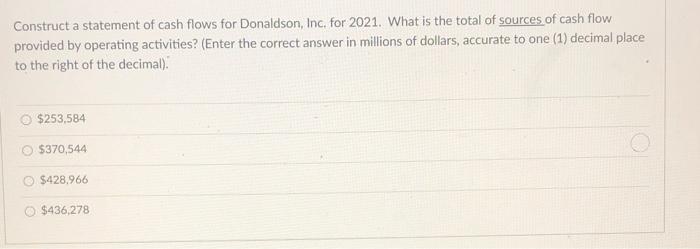
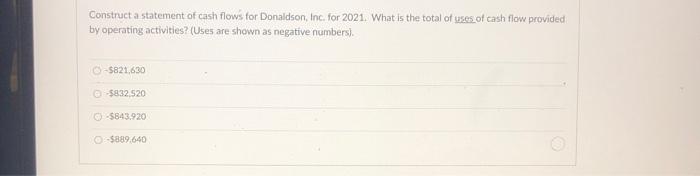
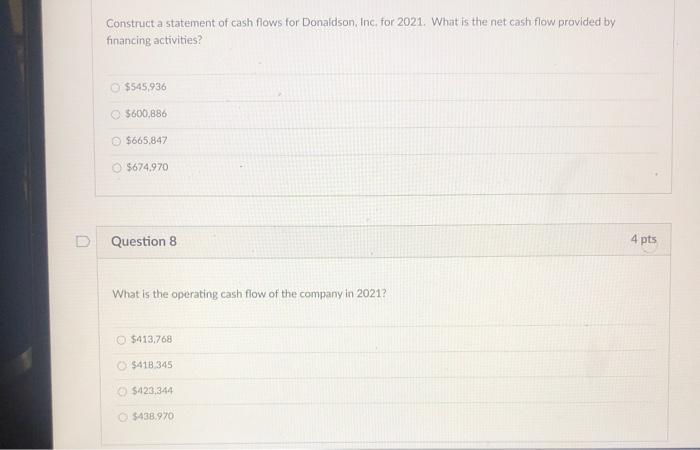
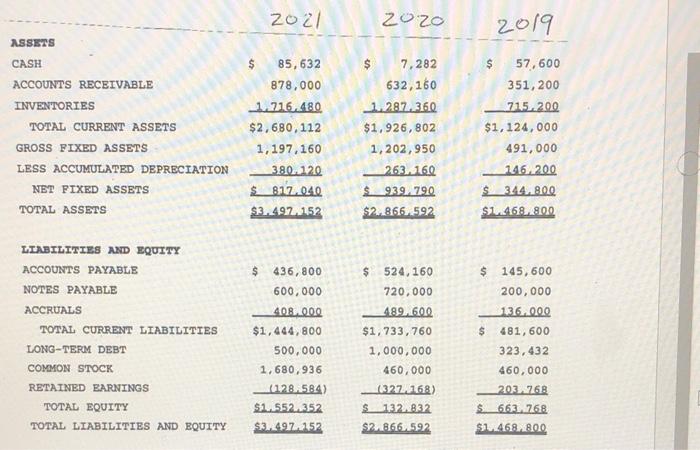
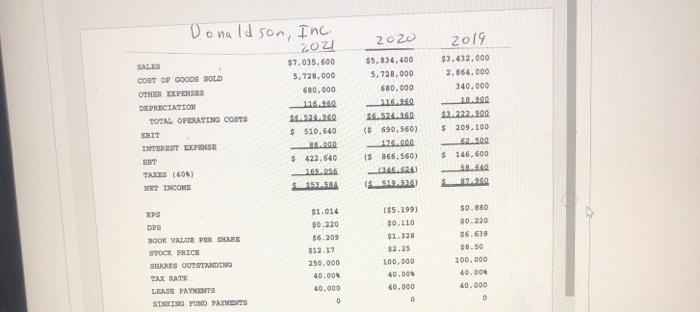
Industry Average Ratios for December 31, 2021 Current 2.7% Total Asset Turnover 2.6X Return on Assets 9.1% Quick 1.OX Debt Ratio 50% Return on Equity 18.2% Inventory Turnover 4.9X Interest Coverage Ratio 6.2x Price/Earnings 14.2x Ratio 32.0 Net Profit Margin 3.5% Market-to- Book Ratio 2.4% Days' Sales Outstanding Fixed Asset Turnover 7.0X Earning Power 19.1% Construct a statement of cash flows for Donaldson, Inc. for 2021. What is the total of sources of cash flow provided by operating activities? (Enter the correct answer in millions of dollars, accurate to one (1) decimal place to the right of the decimal). $253,584 $370,544 $428.966 $436,278 Construct a statement of cash flows for Donaldson, Inc. for 2021. What is the total of uses of cash flow provided by operating activities? (Uses are shown as negative numbers). -5821,630 $832.520 -5843.920 $889.640 Construct a statement of cash flows for Donaldson, Inc for 2021. What is the net cash flow provided by financing activities? @ $545,936 $600,886 $665.847 $674.970 D Question 8 4 pts What is the operating cash flow of the company in 2021? $413,768 $418 345 $423,344 $438.970 2021 2020 2019 ASSETS CASH ACCOUNTS RECEIVABLE INVENTORIES TOTAL CURRENT ASSETS GROSS FIXED ASSETS LESS ACCUMULATED DEPRECIATION NET FIXED ASSETS TOTAL ASSETS 85,632 878,000 1.716.480 $2,680,112 1,197,160 3800120 $ 817.040 $3.4971152 $ 7,282 632,160 1.287.360 $1,926, 802 1,202,950 263.160 $939.790 $2.866.592 57,600 351,200 715..200 $1,124,000 491,000 146.200 S 344.800 SL.468.800 LIABILITIES AND EQUITY ACCOUNTS PAYABLE NOTES PAYABLE ACCRUALS TOTAL CURRENT LIABILITIES LONG-TERM DEBT COMMON STOCK RETAINED EARNINGS TOTAL EQUITY TOTAL LIABILITIES AND EQUITY $ 436,800 600,000 408.000 $1,444,800 500,000 1,680,936 128.584) $1.552352 $3.497152 $ 524,160 720.000 489.600 $1,733, 760 1,000,000 460,000 (1327168) $ 132,832 $2.866.592 $ 145,600 200,000 136.000 $ 481,600 323, 432 460,000 203.7768 $663.768 $2.468.800 Donaldson, 2020 $5,834,400 5,728.000 600.000 SALES COOT OP GOODS SOLD OTHER DEPENSES DEPRECIATION TOTAL OPERATING COSTS EBIT TORST EXPOSE ET TAKES (400) SET INCOME Inc 2021 $7.035,600 5.728.000 680.000 116.26 6132360 $ 510,640 BL300 $422.640 162.256 584 2019 $3.432,000 2,364,000 340.000 10.900 2.222.900 $ 209,100 S2360 $ 690,560) SUGAR ($ 366,560) -6624 (235 $ 146,600 SBS 12.950 PS DPS NOOK VALUE PO SHARE STOCK PRICE SHARES OUTSTANDO SAX RUTE LEME PAVICONS STRENO PUD PAYMENTS 91.014 $0.220 $6.209 $12.17 250.000 40.000 40.000 0 (95.199) 30.110 $1.328 $2.25 100.000 40.000 40.000 0 $0.830 00.220 $6.63 $8.50 200.000 40.000 40.000 0
Step by Step Solution
There are 3 Steps involved in it

Get step-by-step solutions from verified subject matter experts