

Question: Inference for one sample proportion CI and HT) Multiple Choice 1 point es HARD/PAPER. Bar Chart of Hard/Paper 300 250 Diagram courtesy of Scholastic .
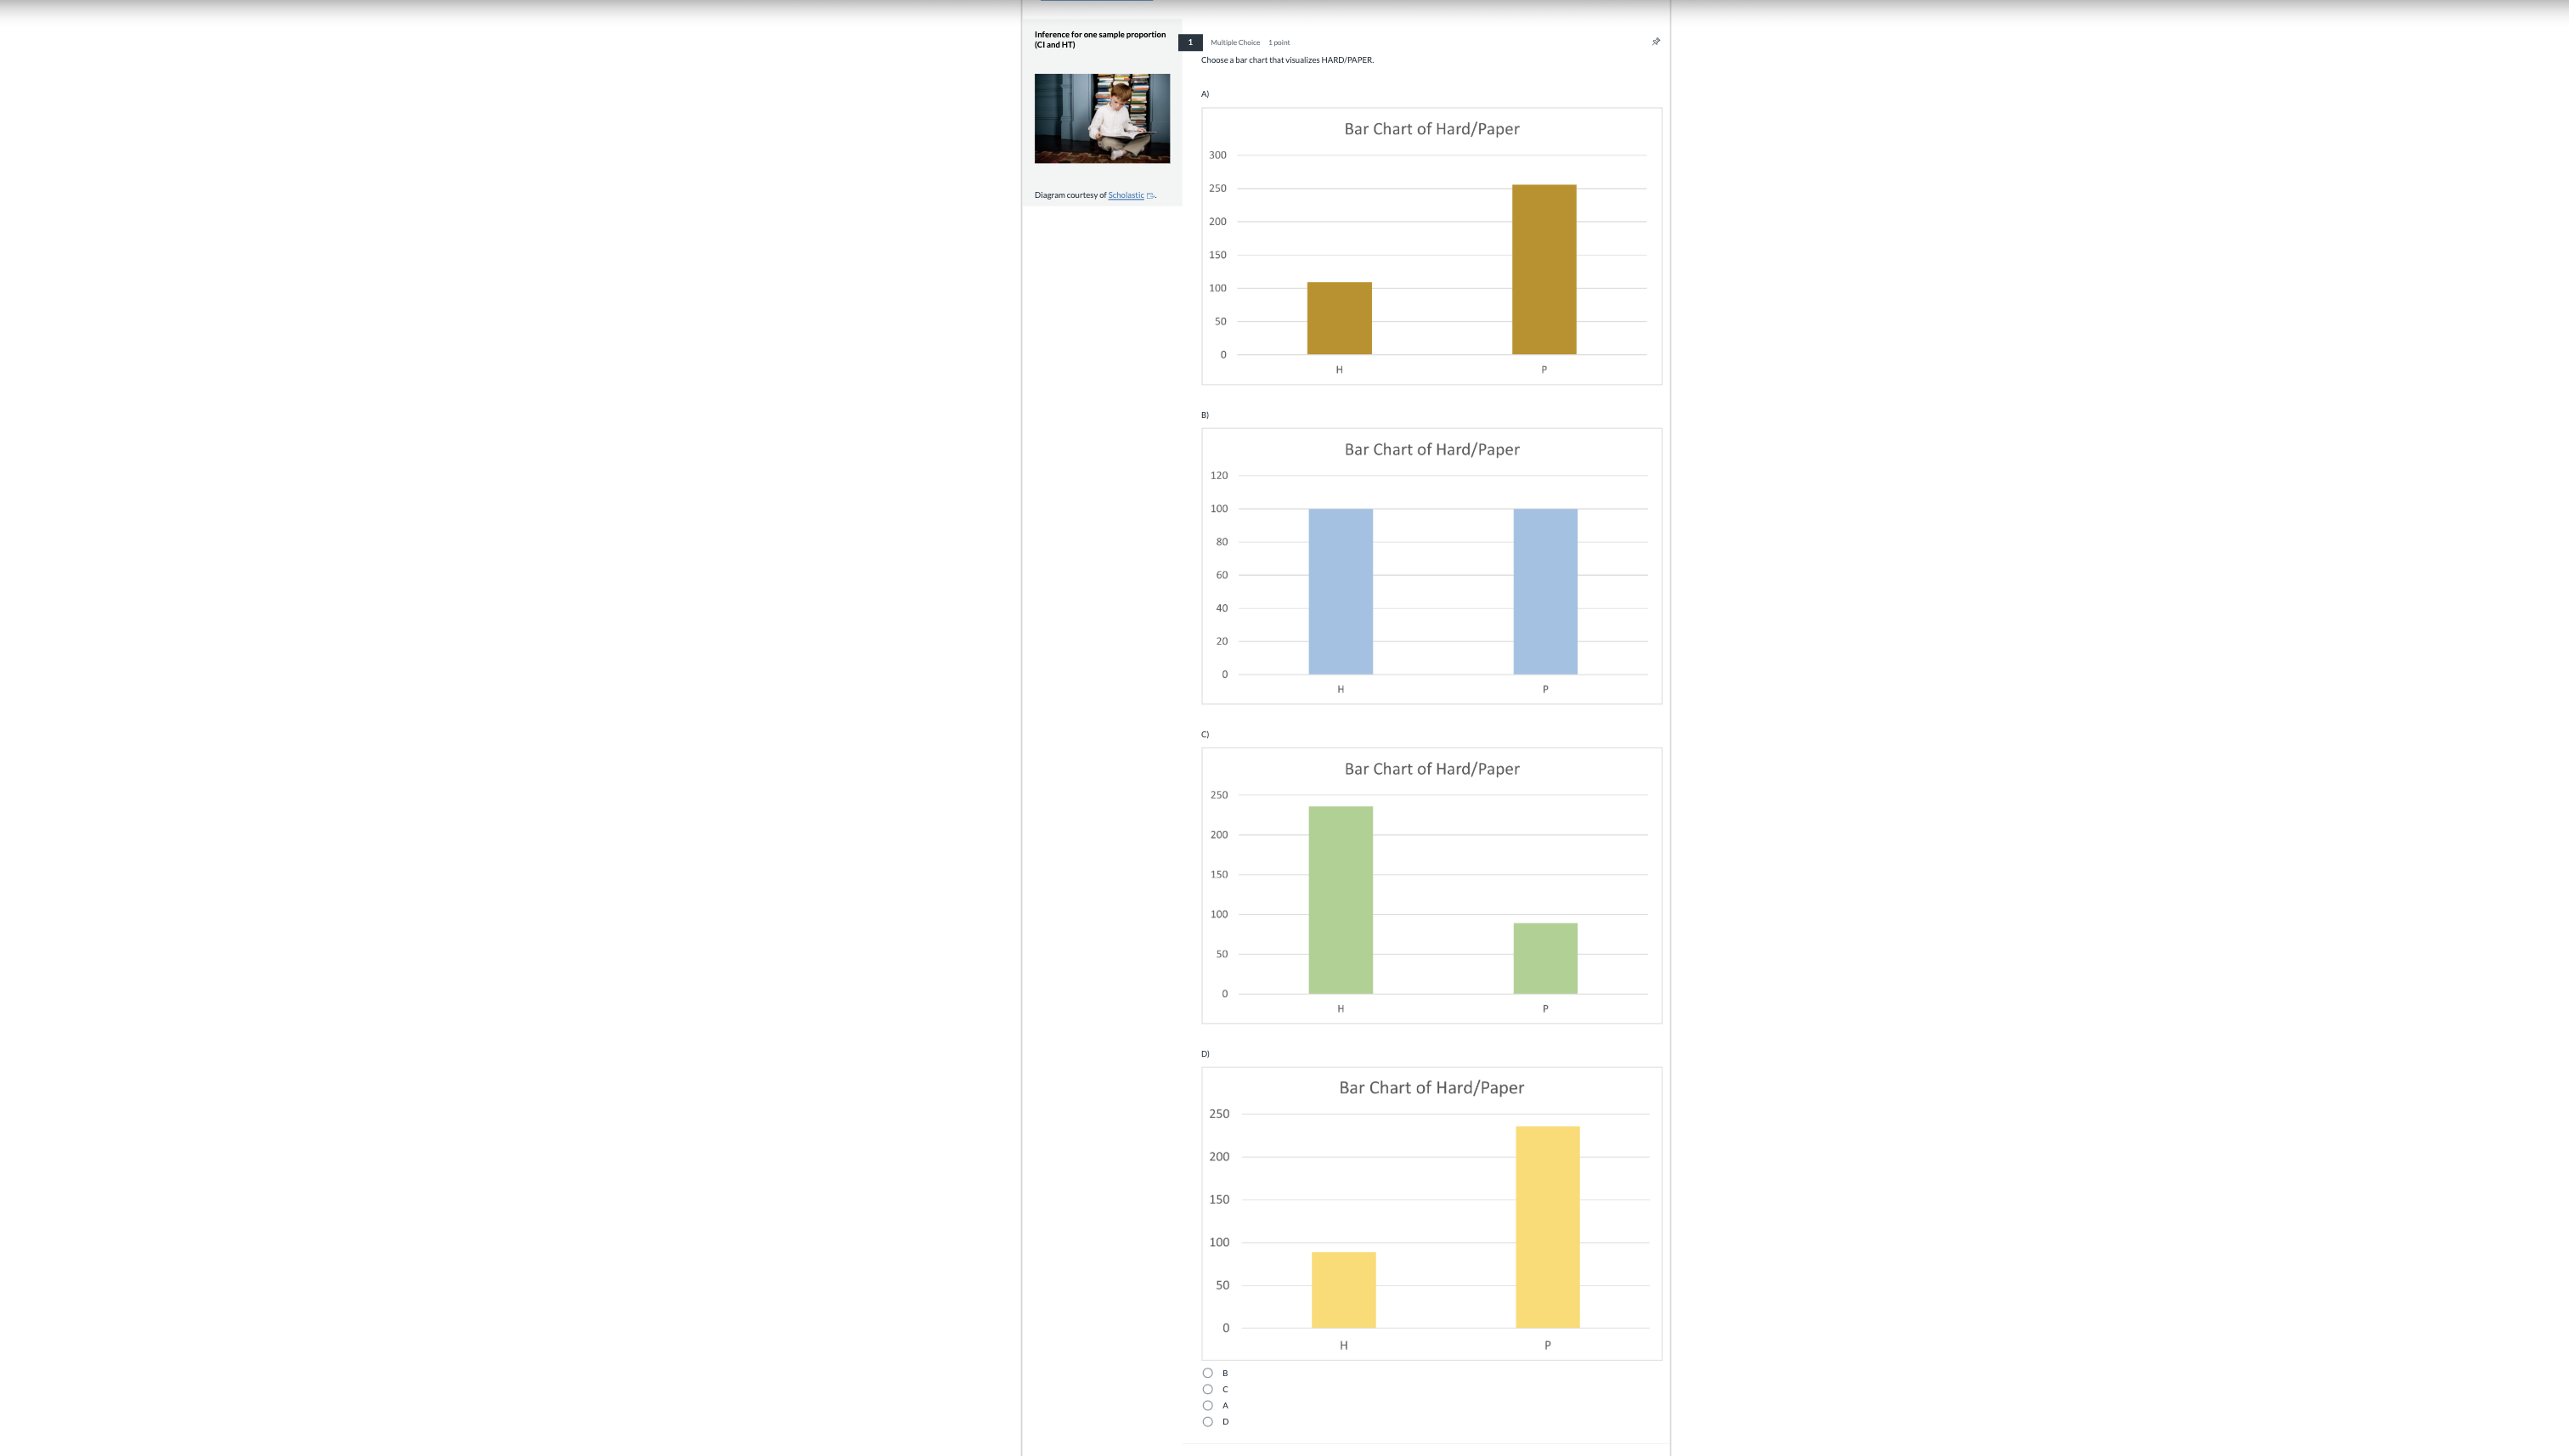
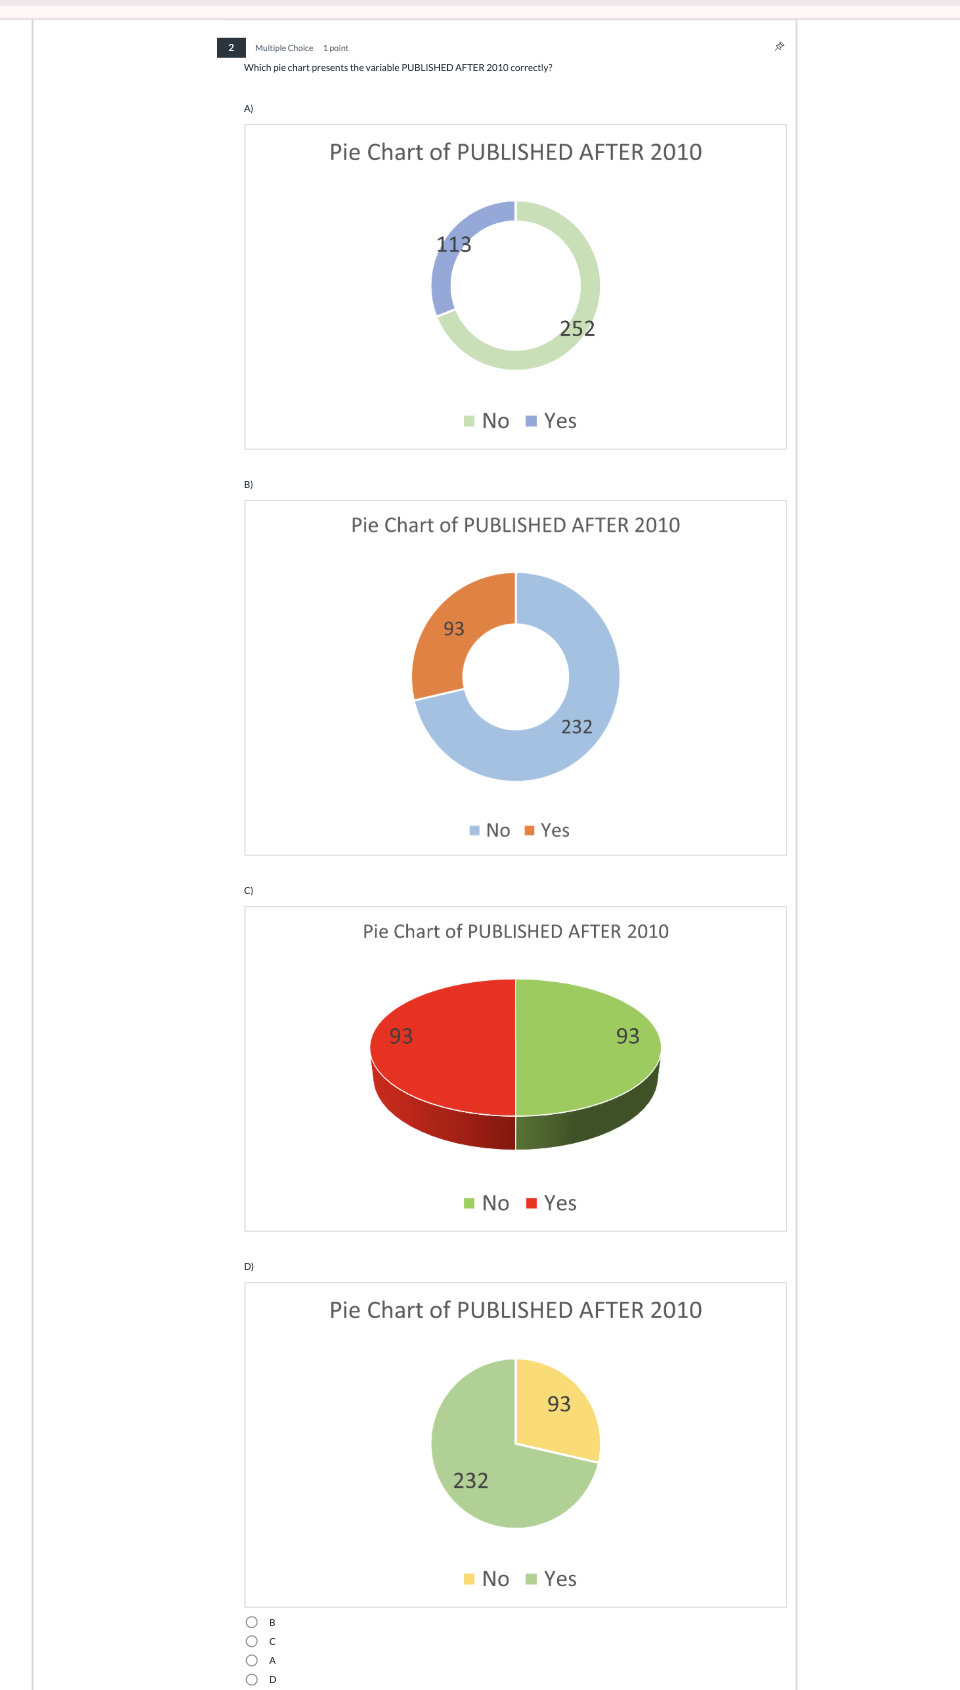 Inference for one sample proportion CI and HT) Multiple Choice 1 point es HARD/PAPER. Bar Chart of Hard/Paper 300 250 Diagram courtesy of Scholastic . 200 150 100 H Bar Chart of Hard/Paper 120 100 80 8 C) Bar Chart of Hard/Paper 250 200 150 100 50 Bar Chart of Hard/Paper 250 200 150 100 50 HMultiple Cheiee 1 point Which pie chart presents the variable PUBLISHED AFTER 2010 correctly? A) Pie Chart of PUBLISHED AFTER 2010 252 No m Yes Pie Chart of PUBLISHED AFTER 2010 = No @ Yes Q Pie Chart of PUBLISHED AFTER 2010 =e No w Yes Pie Chart of PUBLISHED AFTER 2010 No @ Yes o000 oD PFPOG 3 Multiple Choice 1 point Verify that the sample size is large enough in each group (hardcover and/or paperback) to use the normal distribution to run a test or a proportion of hardcover books. The condition is met, because the sample size of both the hardcover and paperback books is greater than 30. O The condition is met, because the sample size of the hardcover greater than 30 (the paperback books don't have to meet this condition). O The condition is met, because the sample size of both the hardcov and paperback books is greater than 10. The condition is met, because the sample size of the hardcover books is greater than 10 (the paperback books don't have to meet this condition). Fill in the Blank 1.5 points Choose the null and alternative hypotheses to test if the percentage of hardcover books is below 30%. Ho (null hypothesis): the proportion of hardcover books on Amazon is equal to 0.3 Ha (alternative hypothesis): the proportion of hardcover books on Amazon is less than 0.3. 5 Fill in the Blank 1 point Find the sample proportion of hardcover books p^, Z test statistic, and the p-value. Round your numbers to two decimal places. p* = type your answer... type your answer... . p-value = type your answer... 6 Fill in the Blank 1.5 points Interpret the the test result, in context. We accept the null hypothesis . There is enough evidence to say that e sample size of choose your answer . hardcover books on Amazon is choose your answer. V 0.3. 7 Fill in the Blank 1 point Find the proportion (not the percentage) of books on Amazon that were published after 2010. Round the proportion to two decimal places sample proportion = |type your answer.. Fill in the Blank 1 point Construct a 97% confidence interval for the proportion of books on Amazon that were published after 2010. Round to two decimal places. type your answer.. type your answer. 9 Fill in the Blank 1 point Interpret the interval above, in context. We are choose your answer. confident that the choose your answer,- of choose your answer . v books on Amazon that were published after 2010 is between the two values above from question 8. Submit
Step by Step Solution
There are 3 Steps involved in it

Get step-by-step solutions from verified subject matter experts