

Question: Inflation and Price Level: Worksheet 2 Using the table below, calculate the increase in the minimum wage between years. The first cell is blocked
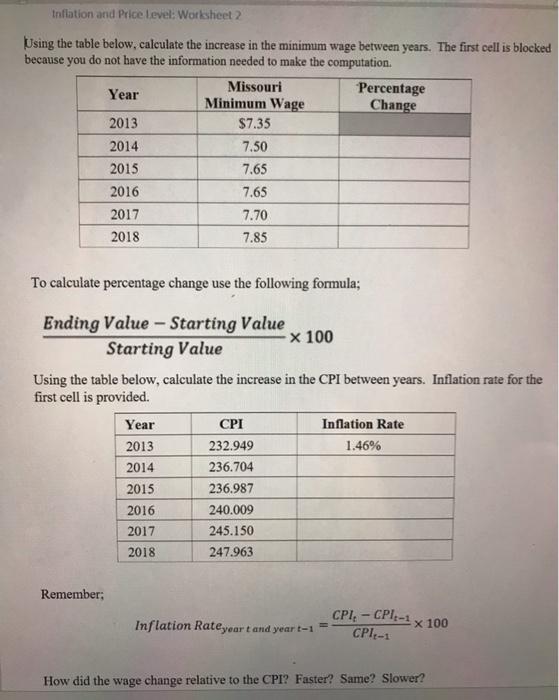
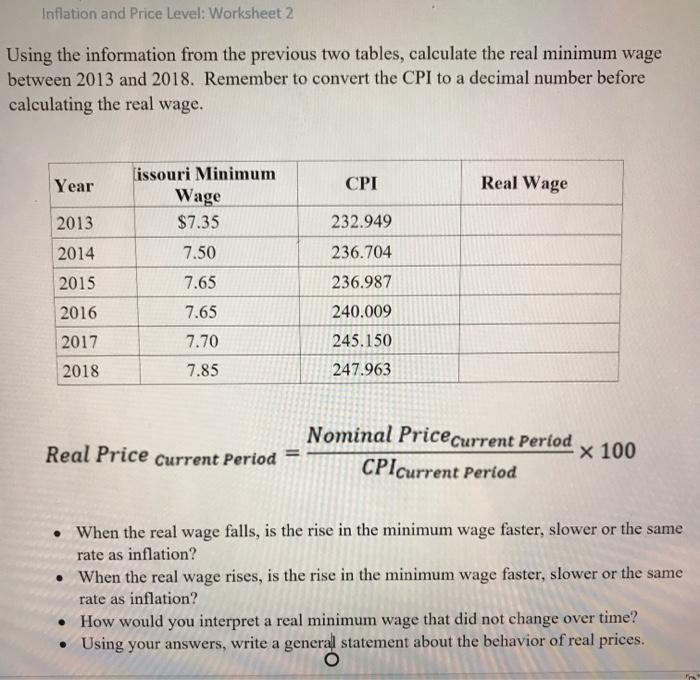
Inflation and Price Level: Worksheet 2 Using the table below, calculate the increase in the minimum wage between years. The first cell is blocked because you do not have the information needed to make the computation. Missouri Percentage Change Year Minimum Wage 2013 $7.35 2014 7.50 2015 7.65 2016 7.65 2017 7.70 2018 7.85 To calculate percentage change use the following formula; Ending Value Starting Value Starting Value x 100 Using the table below, calculate the increase in the CPI between years. Inflation rate for the first cell is provided. Year CPI Inflation Rate 2013 232.949 1.46% 2014 236.704 2015 236.987 2016 240.009 2017 245.150 2018 247.963 Remember; CPI, - CPI,-1 CPI-1 Inflation Rateyear t and year t-1 x 100 How did the wage change relative to the CPI? Faster? Same? Slower? Inflation and Price Level: Worksheet 2 Using the information from the previous two tables, calculate the real minimum wage between 2013 and 2018. Remember to convert the CPI to a decimal number before calculating the real wage. lissouri Minimum Year CPI Real Wage Wage 2013 $7.35 232.949 2014 7.50 236.704 2015 7.65 236.987 2016 7.65 240.009 2017 7.70 245.150 2018 7.85 247.963 Nominal Pricecurrent Period Real Price Current Period x 100 CPIcurrent Period When the real wage falls, is the rise in the minimum wage faster, slower or the same rate as inflation? When the real wage rises, is the rise in the minimum wage faster, slower or the same rate as inflation? How would you interpret a real minimum wage that did not change over time? Using your answers, write a general statement about the behavior of real prices.
Step by Step Solution
3.39 Rating (158 Votes )
There are 3 Steps involved in it
SPI Resel weeye 315 2013 232949 2014 236704 316 201j 236787 ... View full answer

Get step-by-step solutions from verified subject matter experts