

Question: Info obtained on _ _ _ _ _ _ 4 / 2 7 / 2 0 2 5 _ _ _ _ _ _ _
Info obtained on
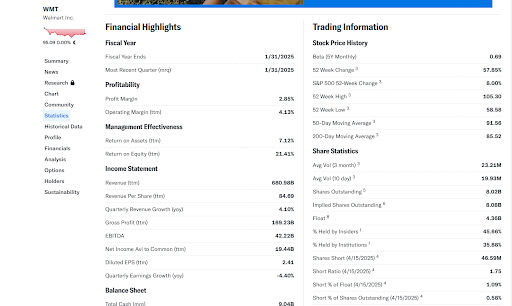
from Yahoo Finance
Price
Shares Outstanding
Beta Y Monthly
Annual Dividend Rate
Next Year growth
STD Jan
STD Jan
LTD Jan
LTD Jan
Interest expense
from the annual report
Tax rate
from Morningstar.com
ROE
Payout ratio
from excel doc
Risk free
Market premium
Calculations:
Dividend growth rate
historical dividends g attach the excel document
Sustainable growth rate g
Total debt
Total debt
Cost of equity
CAPM
Ce
DDM
Using analysts estimate Ce
Using historical data Ce
Using sustainable growth rate Ce
What cost of equity are you using and why? You may choose one of the four options or use an average of two or more.
We are using an average of the CAPM and the DDM based on analysts growth resulting in a total cost of equity of We chose this approach because both models provide valuable insights: CAPM reflects marketbased risk through beta while DDM incorporates companyspecific growth. Since the firm pays dividends expected to grow at a constant rate, the constantgrowth model is appropriate. When both CAPM and DDM are applicable, the best estimate of cost of equity is the average of the two.
Cost of debt
Cd
Aftertax Cd
Weights
Total Debt
Mk value of equity
We
Wd
WACC
Welrarlimes.
Financial Highlights
Fiseal Year
Profitalility
Frote Mayin
Opentring Margin ran
Managemen! Effectiveness
Betumas Astives info
Wetum an Eqaty tim
Inoame Statement
Sorwove find
Rewana Per Share tiri
Quan Proftns
:
EBITOA
Nat Insare Ral sa Carmen itmi
D
Chined EPSOMT
Oaanloly Eomines Browth yay
Balance Sheet
Total Canh Inos
Trading Information
Stack Prics Histsey
Sham Statistics
Step by Step Solution
There are 3 Steps involved in it
1 Expert Approved Answer
Step: 1 Unlock

Question Has Been Solved by an Expert!
Get step-by-step solutions from verified subject matter experts
Step: 2 Unlock
Step: 3 Unlock