

Question: Information for problems 1-5: Exercise One: Bull Spread with Calls On March 17, 2021 the following August 20, 2021 expiration options on Microsoft common stock
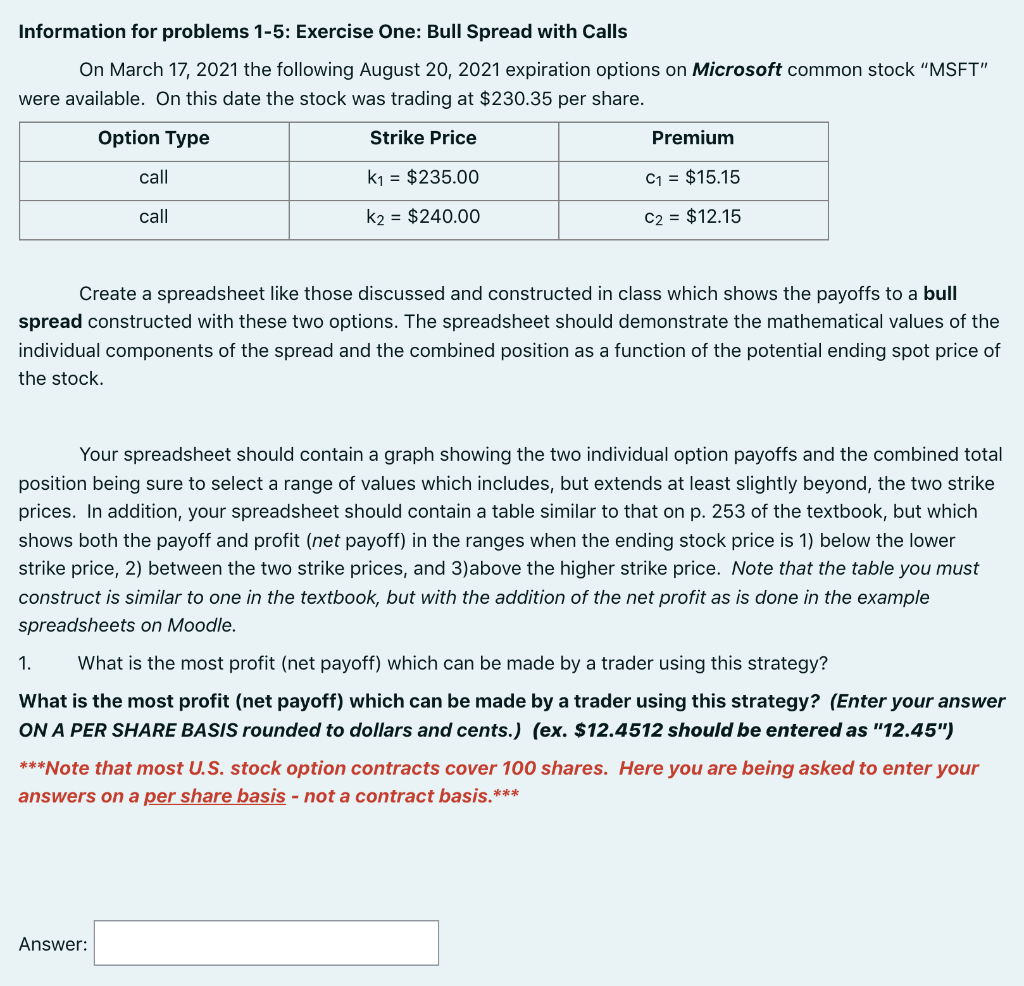
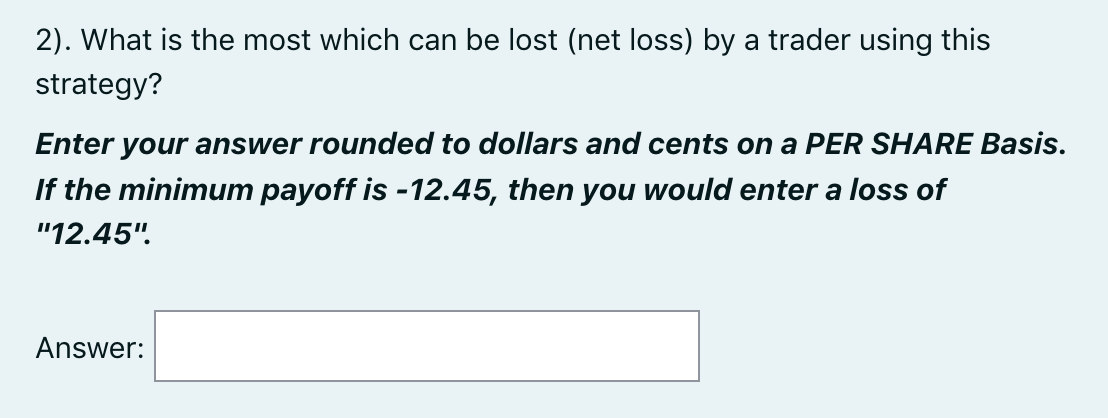
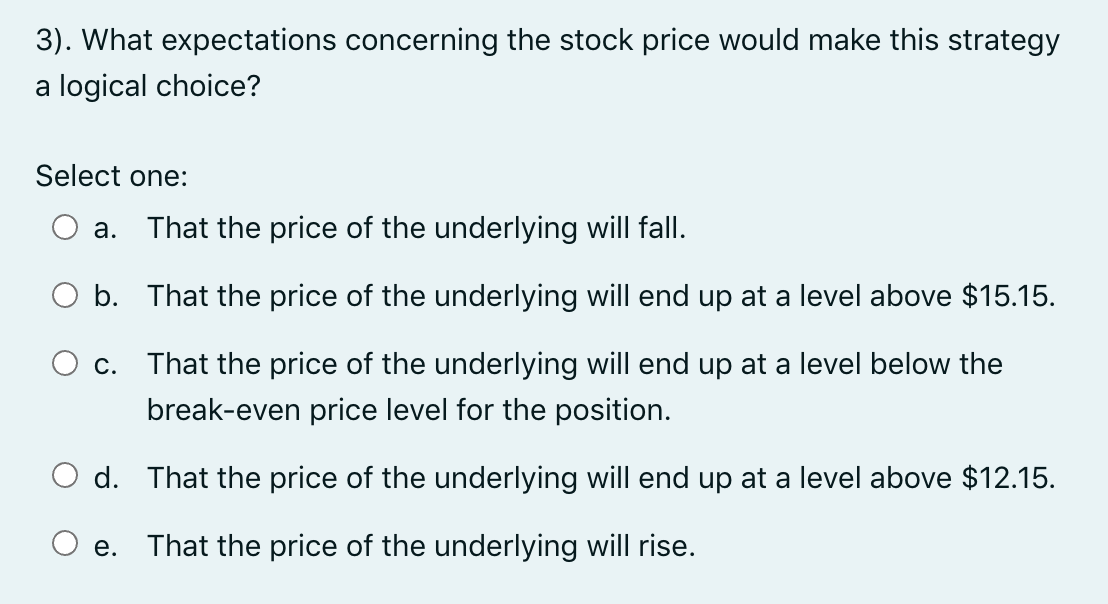
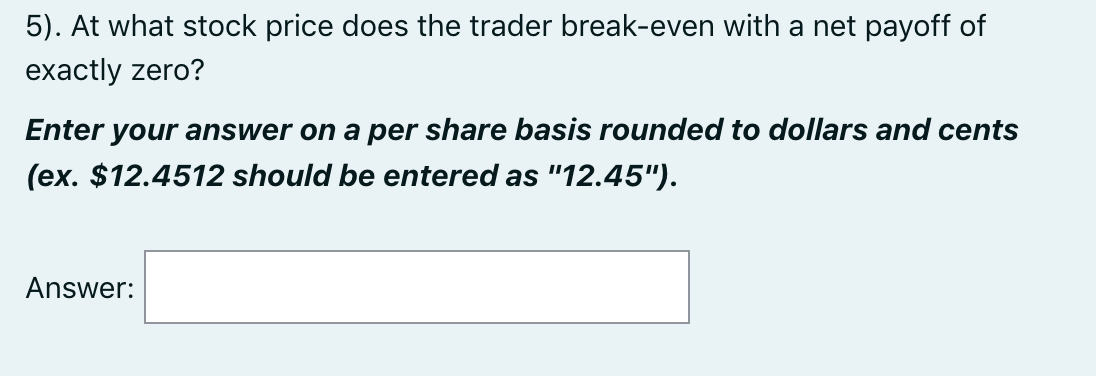
Information for problems 1-5: Exercise One: Bull Spread with Calls On March 17, 2021 the following August 20, 2021 expiration options on Microsoft common stock "MSFT" were available. On this date the stock was trading at $230.35 per share. Option Type Strike Price Premium call k1 = $235.00 C1 = $15.15 call k2 = $240.00 C2 = $12.15 Create a spreadsheet like those discussed and constructed in class which shows the payoffs to a bull spread constructed with these two options. The spreadsheet should demonstrate the mathematical values of the individual components of the spread and the combined position as a function of the potential ending spot price of the stock. Your spreadsheet should contain a graph showing the two individual option payoffs and the combined total position being sure to select a range of values which includes, but extends at least slightly beyond, the two strike prices. In addition, your spreadsheet should contain a table similar to that on p. 253 of the textbook, but which shows both the payoff and profit (net payoff) in the ranges when the ending stock price is 1) below the lower strike price, 2) between the two strike prices, and 3)above the higher strike price. Note that the table you must construct is similar to one in the textbook, but with the addition of the net profit as is done in the example spreadsheets on Moodle. 1. What is the most profit (net payoff) which can be made by a trader using this strategy? What is the most profit (net payoff) which can be made by a trader using this strategy? (Enter your answer ON A PER SHARE BASIS rounded to dollars and cents.) (ex. $12.4512 should be entered as "12.45") ***Note that most U.S. stock option contracts cover 100 shares. Here you are being asked to enter your answers on a per share basis - not a contract basis.*** Answer: 2). What is the most which can be lost (net loss) by a trader using this strategy? Enter your answer rounded to dollars and cents on a PER SHARE Basis. If the minimum payoff is -12.45, then you would enter a loss of "12.45". Answer: 3). What expectations concerning the stock price would make this strategy a logical choice? Select one: a. That the price of the underlying will fall. O b. That the price of the underlying will end up at a level above $15.15. C. That the price of the underlying will end up at a level below the break-even price level for the position. d. That the price of the underlying will end up at a level above $12.15. O e. That the price of the underlying will rise. 5). At what stock price does the trader break-even with a net payoff of exactly zero? Enter your answer on a per share basis rounded to dollars and cents (ex. $12.4512 should be entered as "12.45"). Answer: Information for problems 1-5: Exercise One: Bull Spread with Calls On March 17, 2021 the following August 20, 2021 expiration options on Microsoft common stock "MSFT" were available. On this date the stock was trading at $230.35 per share. Option Type Strike Price Premium call k1 = $235.00 C1 = $15.15 call k2 = $240.00 C2 = $12.15 Create a spreadsheet like those discussed and constructed in class which shows the payoffs to a bull spread constructed with these two options. The spreadsheet should demonstrate the mathematical values of the individual components of the spread and the combined position as a function of the potential ending spot price of the stock. Your spreadsheet should contain a graph showing the two individual option payoffs and the combined total position being sure to select a range of values which includes, but extends at least slightly beyond, the two strike prices. In addition, your spreadsheet should contain a table similar to that on p. 253 of the textbook, but which shows both the payoff and profit (net payoff) in the ranges when the ending stock price is 1) below the lower strike price, 2) between the two strike prices, and 3)above the higher strike price. Note that the table you must construct is similar to one in the textbook, but with the addition of the net profit as is done in the example spreadsheets on Moodle. 1. What is the most profit (net payoff) which can be made by a trader using this strategy? What is the most profit (net payoff) which can be made by a trader using this strategy? (Enter your answer ON A PER SHARE BASIS rounded to dollars and cents.) (ex. $12.4512 should be entered as "12.45") ***Note that most U.S. stock option contracts cover 100 shares. Here you are being asked to enter your answers on a per share basis - not a contract basis.*** Answer: 2). What is the most which can be lost (net loss) by a trader using this strategy? Enter your answer rounded to dollars and cents on a PER SHARE Basis. If the minimum payoff is -12.45, then you would enter a loss of "12.45". Answer: 3). What expectations concerning the stock price would make this strategy a logical choice? Select one: a. That the price of the underlying will fall. O b. That the price of the underlying will end up at a level above $15.15. C. That the price of the underlying will end up at a level below the break-even price level for the position. d. That the price of the underlying will end up at a level above $12.15. O e. That the price of the underlying will rise. 5). At what stock price does the trader break-even with a net payoff of exactly zero? Enter your answer on a per share basis rounded to dollars and cents (ex. $12.4512 should be entered as "12.45")
Step by Step Solution
There are 3 Steps involved in it

Get step-by-step solutions from verified subject matter experts