

Question: Information required to solve the question: 5. (21 points) Continue with the version of the two-period consumption model discussed in question (4). (a) Suppose that

Information required to solve the question:
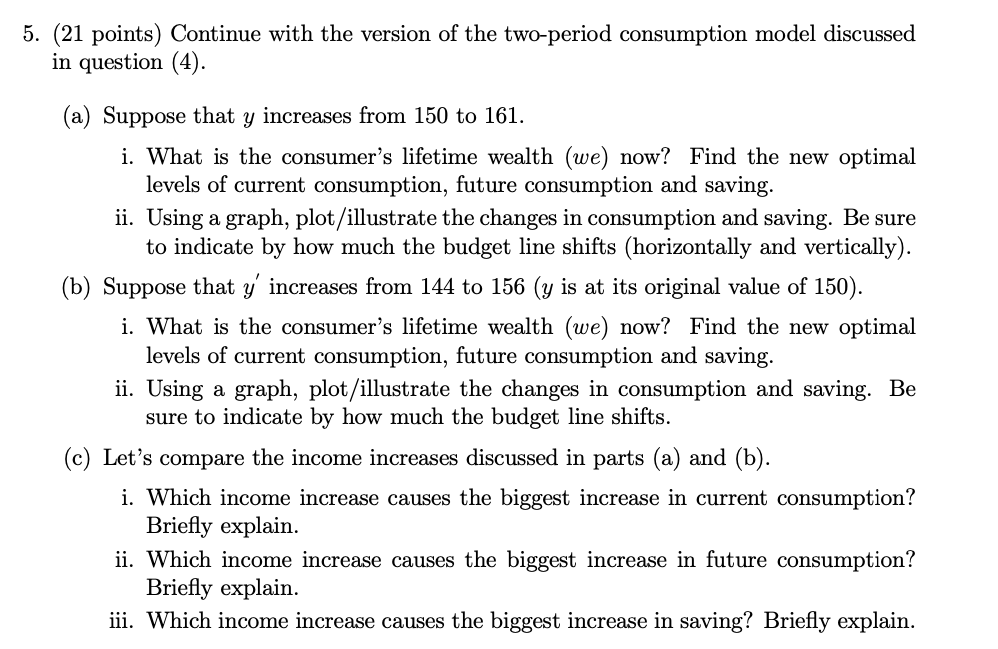

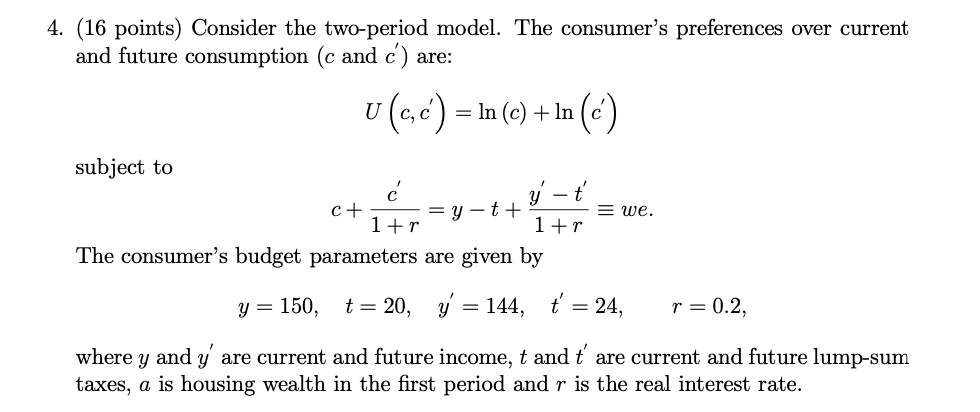
5. (21 points) Continue with the version of the two-period consumption model discussed in question (4). (a) Suppose that 3; increases from 150 to 161. i. What is the consumer's lifetime wealth (we) now? Find the new optimal levels of current consumption, future consumption and saving. ii. Using a graph, plot / illustrate the changes in consumption and saving. Be sure to indicate by how much the budget line shifts {horizontally and vertically). (b) Suppose that *9" increases from 144 to 156 (y is at its original value of 150). i. What is the consumer's lifetime wealth (we) now? Find the new optimal levels of current consumption, future consumption and saving. ii. Using a graph, plot/illustrate the changes in consumption and saving. Be sure to indicate by how much the budget line shifts. (c) Let's compare the income increases discussed in parts (a) and (b). i. Which income increase causes the biggest increase in current consumption? Briey explain. ii. Which income increase causes the biggest increase in future consumption? Briey explain. iii. Which income increase causes the biggest increase in saving? Briey explain. 4. {15 points) Consider the two-period model. The consumer's preferences over current and future consumption (c and c!) are: subject to 1 + 1' + 1 + a" The consumer's budget parameters are given by y = 150, t: 20, y' = 144, t' = 24, r = 0.2, where y and y; are current and future income, t and ti are current and future lump-sum tastes1 a is housing wealth in the rst period and 7' is the real interest rate
Step by Step Solution
There are 3 Steps involved in it

Get step-by-step solutions from verified subject matter experts