

Question: Information required to upload to Mathlab: (Table from Excel) (convert to .csv) from the link in the NOTES. Project Description: As a basic application of
Information required to upload to Mathlab: (Table from Excel) (convert to .csv) from the link in the NOTES.
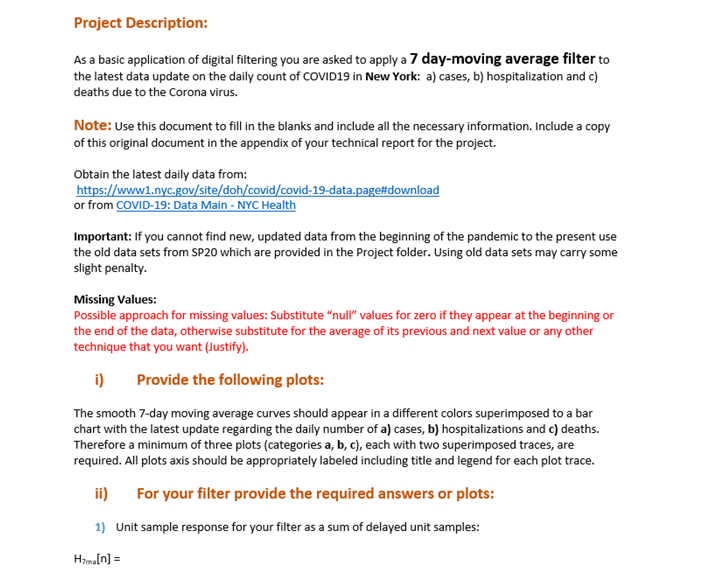
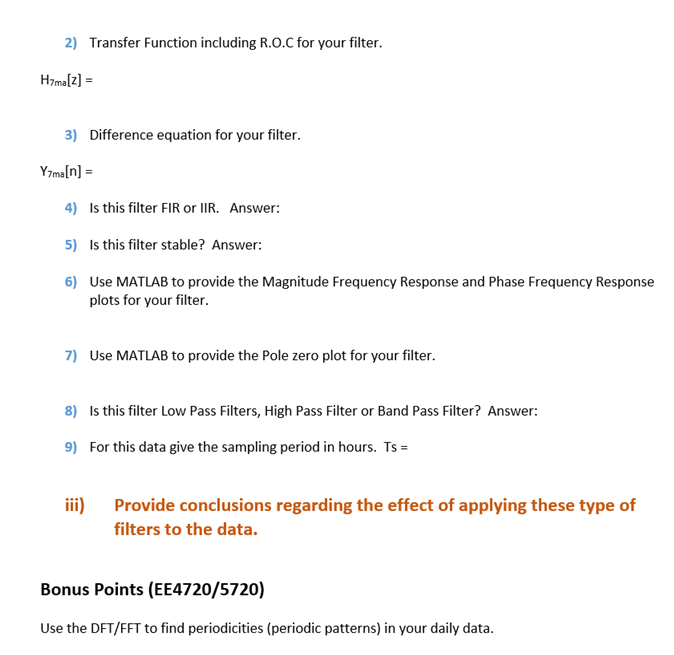
Project Description: As a basic application of digital filtering you are asked to apply a 7 day-moving average filter to the latest data update on the daily count of COVID19 in New York: a) cases, b) hospitalization and c) deaths due to the Corona virus. Note: Use this document to fill in the blanks and include all the necessary information. Include a copy of this original document in the appendix of your technical report for the project. Obtain the latest daily data from: https://www1.nyc.gov/site/doh/covid/covid-19-data.page#download or from COVID-19: Data Main - NYC Health Important: If you cannot find new, updated data from the beginning of the pandemic to the present use the old data sets from SP20 which are provided in the Project folder. Using old data sets may carry some slight penalty. Missing Values: Possible approach for missing values: Substitute "null" values for zero if they appear at the beginning or the end of the data, otherwise substitute for the average of its previous and next value or any other technique that you want (Justify). i) Provide the following plots: The smooth 7-day moving average curves should appear in a different colors superimposed to a bar chart with the latest update regarding the daily number of a) cases, b) hospitalizations and c) deaths. Therefore a minimum of three plots (categories a, b, c), each with two superimposed traces, are required. All plots axis should be appropriately labeled including title and legend for each plot trace. ii) For your filter provide the required answers or plots: 1) Unit sample response for your filter as a sum of delayed unit samples: Huma[n] = 2) Transfer Function including R.O.C for your filter. Hyma[2] = 3) Difference equation for your filter. Yzma[n] = 4) Is this filter FIR or IIR. Answer: 5) Is this filter stable? Answer: 6) Use MATLAB to provide the Magnitude Frequency Response and Phase Frequency Response plots for your filter. 7) Use MATLAB to provide the Pole zero plot for your filter. 8) Is this filter Low Pass Filters, High Pass Filter or Band Pass Filter? Answer: 9) For this data give the sampling period in hours. Ts = iii) Provide conclusions regarding the effect of applying these type of filters to the data. Bonus Points (EE4720/5720) Use the DFT/FFT to find periodicities (periodic patterns) in your daily data. Project Description: As a basic application of digital filtering you are asked to apply a 7 day-moving average filter to the latest data update on the daily count of COVID19 in New York: a) cases, b) hospitalization and c) deaths due to the Corona virus. Note: Use this document to fill in the blanks and include all the necessary information. Include a copy of this original document in the appendix of your technical report for the project. Obtain the latest daily data from: https://www1.nyc.gov/site/doh/covid/covid-19-data.page#download or from COVID-19: Data Main - NYC Health Important: If you cannot find new, updated data from the beginning of the pandemic to the present use the old data sets from SP20 which are provided in the Project folder. Using old data sets may carry some slight penalty. Missing Values: Possible approach for missing values: Substitute "null" values for zero if they appear at the beginning or the end of the data, otherwise substitute for the average of its previous and next value or any other technique that you want (Justify). i) Provide the following plots: The smooth 7-day moving average curves should appear in a different colors superimposed to a bar chart with the latest update regarding the daily number of a) cases, b) hospitalizations and c) deaths. Therefore a minimum of three plots (categories a, b, c), each with two superimposed traces, are required. All plots axis should be appropriately labeled including title and legend for each plot trace. ii) For your filter provide the required answers or plots: 1) Unit sample response for your filter as a sum of delayed unit samples: Huma[n] = 2) Transfer Function including R.O.C for your filter. Hyma[2] = 3) Difference equation for your filter. Yzma[n] = 4) Is this filter FIR or IIR. Answer: 5) Is this filter stable? Answer: 6) Use MATLAB to provide the Magnitude Frequency Response and Phase Frequency Response plots for your filter. 7) Use MATLAB to provide the Pole zero plot for your filter. 8) Is this filter Low Pass Filters, High Pass Filter or Band Pass Filter? Answer: 9) For this data give the sampling period in hours. Ts = iii) Provide conclusions regarding the effect of applying these type of filters to the data. Bonus Points (EE4720/5720) Use the DFT/FFT to find periodicities (periodic patterns) in your daily data
Step by Step Solution
There are 3 Steps involved in it

Get step-by-step solutions from verified subject matter experts