

Question: Initial Post: After looking closely at the graphs above, think about these three questions: What do you notice? Share what you are noticing and what
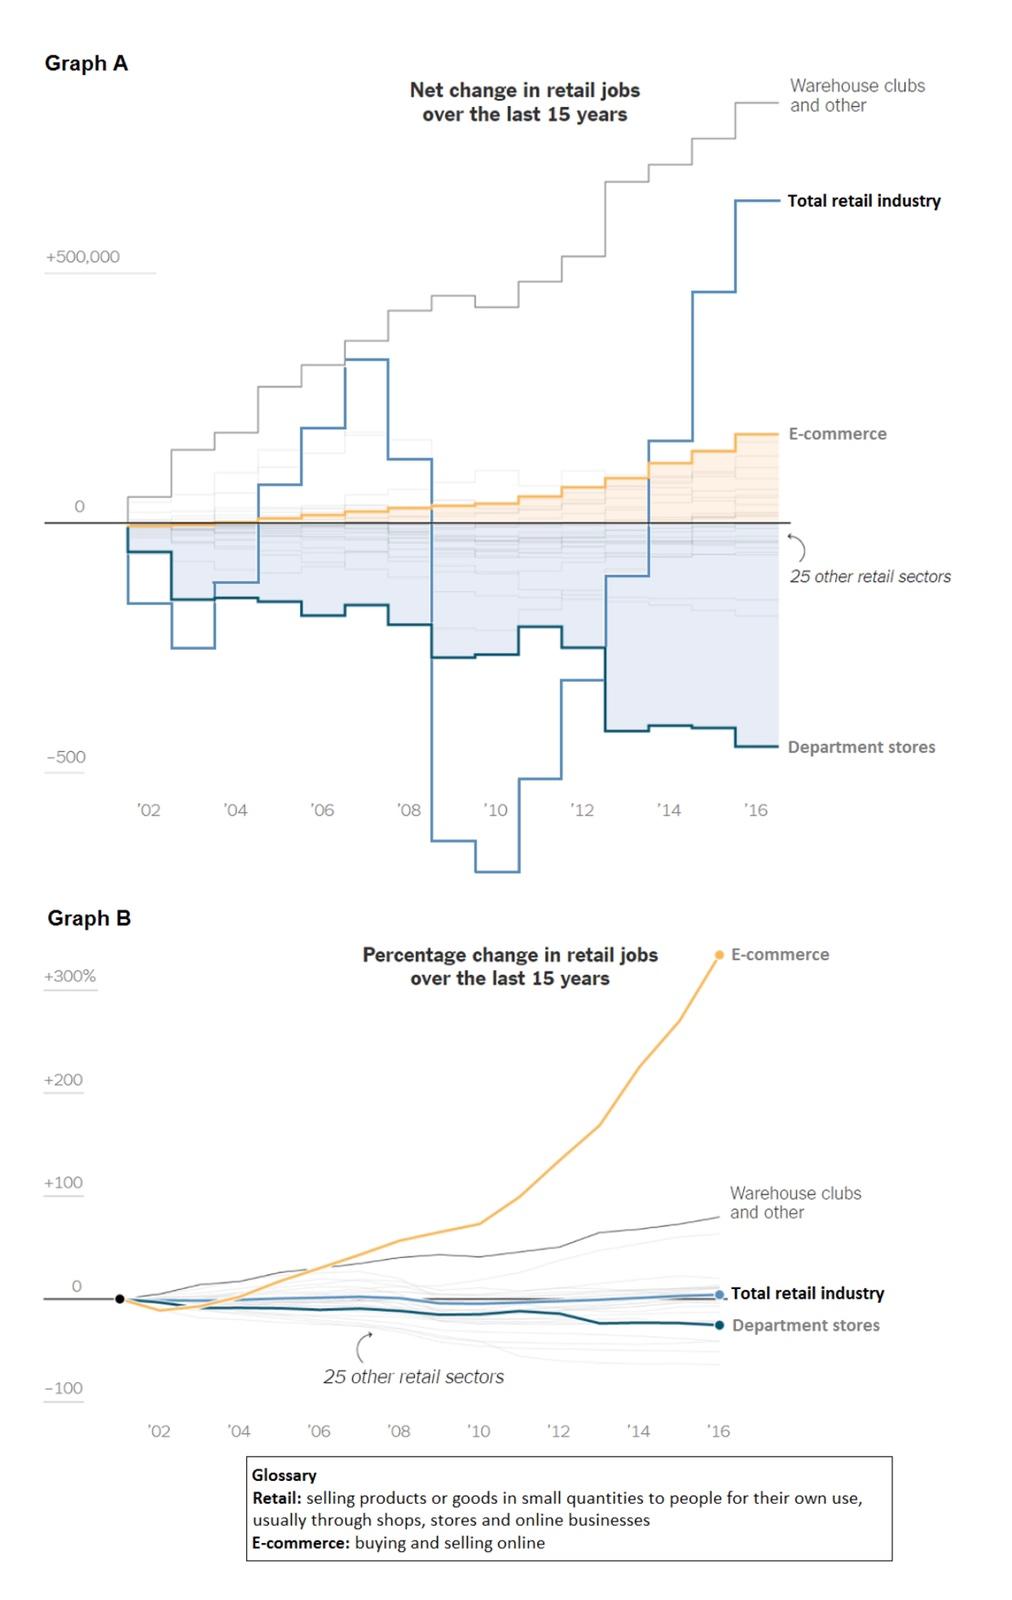
Initial Post: After looking closely at the graphs above, think about these three questions:
- What do you notice? Share what you are noticing and what this may imply.
- What do you wonder? Are there items you noticed that answer what you wonder? Where could you find the answers to what you wonder?
- Whats going on in these graphs? Use what you notice. What can you infer from these graphs beyond what they show directly? Whats the deeper story that comes from these graphs?
Step by Step Solution
There are 3 Steps involved in it
1 Expert Approved Answer
Step: 1 Unlock

Question Has Been Solved by an Expert!
Get step-by-step solutions from verified subject matter experts
Step: 2 Unlock
Step: 3 Unlock