

Question: Inquiry ( 3 marks ) Create a graph of a function given the following information: The instantaneous rate of change at x = 2 is
Inquiry
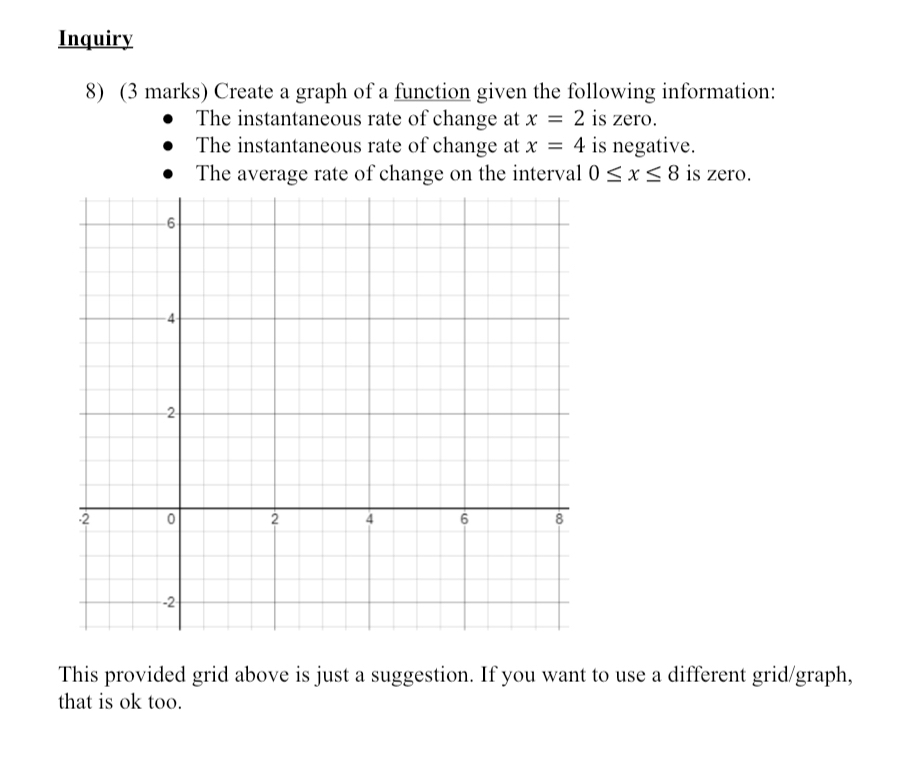
marks Create a graph of a function given the following information:
The instantaneous rate of change at is zero.
The instantaneous rate of change at is negative.
The average rate of change on the interval is zero.
This provided grid above is just a suggestion. If you want to use a different gridgraph that is ok too.
Step by Step Solution
There are 3 Steps involved in it
1 Expert Approved Answer
Step: 1 Unlock

Question Has Been Solved by an Expert!
Get step-by-step solutions from verified subject matter experts
Step: 2 Unlock
Step: 3 Unlock