

Question: Insert line graph below: Year Project X Project 2 0 $ 45,000.00) $ (50,000.00) 1 $ (20,000.00) $ 15,000.00 2 $ 11,000.00 $ 15,000.00 3
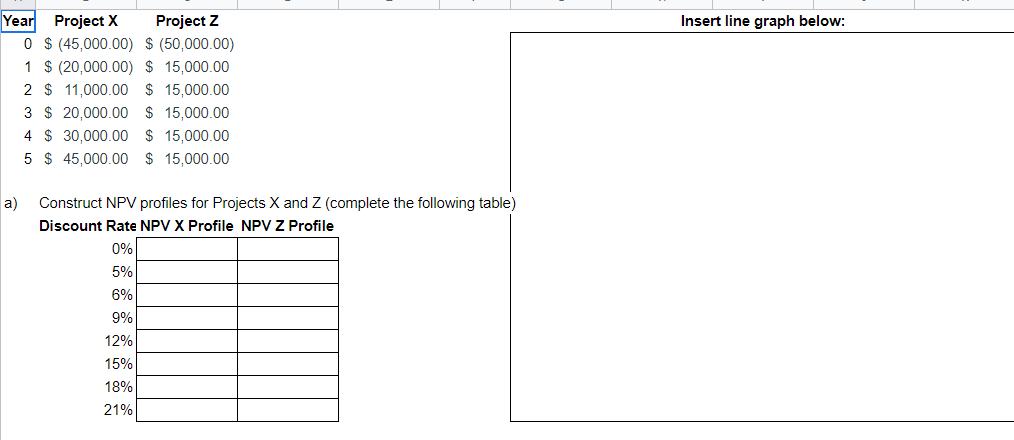
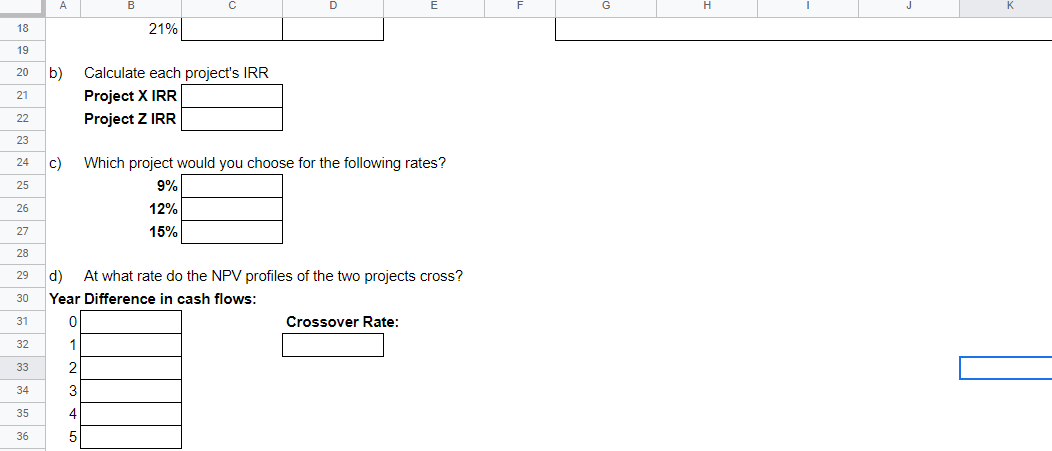
Insert line graph below: Year Project X Project 2 0 $ 45,000.00) $ (50,000.00) 1 $ (20,000.00) $ 15,000.00 2 $ 11,000.00 $ 15,000.00 3 $ 20,000.00 $ 15,000.00 4 $ 30,000.00 $ 15,000.00 5 $ 45,000.00 $ 15,000.00 a) Construct NPV profiles for Projects X and Z (complete the following table) Discount Rate NPV X Profile NPV Z Profile 0% 5% 6% 9% 12% 15% 18% 21% D 18 21% 19 20 b) 21 Calculate each project's IRR Project X IRR Project Z IRR 22 23 24 c) 25 Which project would you choose for the following rates? 9% 12% 15% 26 27 28 29 30 31 d) At what rate do the NPV profiles of the two projects cross? Year Difference in cash flows: 0 Crossover Rate: 1 2 32 33 34 3 4 35 36 5
Step by Step Solution
There are 3 Steps involved in it

Get step-by-step solutions from verified subject matter experts