

Question: Insert Page Layout Formulas Data Review View to Home | | 12 A A Calibri (Body) Num Paste Blu Use the following information to answer
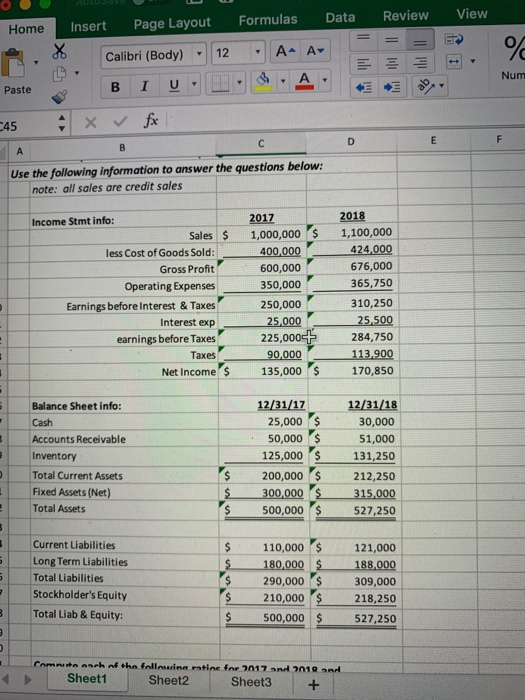
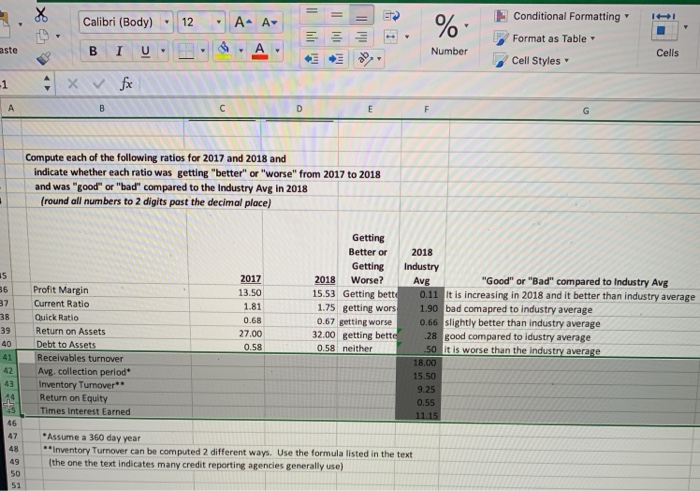
Insert Page Layout Formulas Data Review View to Home | | 12 A A Calibri (Body) Num Paste Blu Use the following information to answer the questions below note: all sales are credit sales 2017 2018 Income Stmt info: Sales 1.000,000 S 1,100,000 424,000 less Cost of Goods Sold: Gross Profit Operating Expenses Earnings before Interest & Taxes Interest exp 600,000 350,000 250,000 676,000 365,750 310,250 earnings before Taxes225,000 284,750 Taxes Net Income 135,000 170,850 Balance Sheet info: Cash Accounts Receivable Inventory Total Current Assets Fixed Assets (Net) Total Assets 12/31/112/31/18 30,000 51,000 131,250 S 200,000S 212,250 $300,000 315,000 500,000 r$ 527,250 25,000 S 50,000 s 125,000 Current Liabilities Long Term Liabilities Total Liabilities Stockholder's Equity Total Liab & Equity: $110,000 121,000 180,000 290,000 $ 309,000 S 210,000 218,250 $ 500,000 527,250 Sheet1 Sheet2 Sheet3 + Conditional Formatting Format as Table Cell Styles Calibri (Body) .12 A ^ A 0 ste Number Cells Compute each of the following ratios for 2017 and 2018 and indicate whether each ratio was getting "better" or "worse" from 2017 to 2018 and was "good" or "bad" compared to the Industry Avg in 2018 (round all numbers to 2 digits past the decimal place) Getting Better or 2018 Getting Industry 2017 13.50 1.81 0.68 27.00 0.58 2018 Worse?Avg 15.53 Getting bett 1.75 getting wors| 1.90|bad com apred to industry average 0.67 getting worse 0.66 slightly better than industry average 32.00 getting bette28 good compared to idustry average "Good" or "Bad" compared to Industry Avg It is increasing in 2018 and it better than industry average 6 Profit Margin 37 Current Ratio 38 39 Return on Assets Quick Ratio 40 41 Receivables turnover 42 Avg.collection period 15.50 9.25 0.55 43 Inventory Turnover as 46 Return on Equity Times Interest Earned 47 Assume a 360 day year 48 Inventory Turnover can be computed 2 different ways. Use the formula listed in the text (the one the text indicates many credit reporting agencies generally use) 49 50
Step by Step Solution
There are 3 Steps involved in it

Get step-by-step solutions from verified subject matter experts