

Question: Insert Page Layout View Help File Home A Xu Formulas Data 10-AA Review EE LOCO . Wrap Test formatting Table Styles Clipboard 1 Question
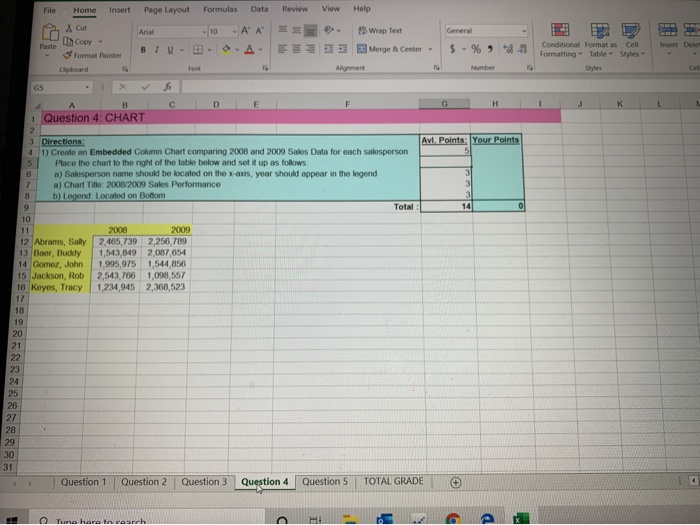
Insert Page Layout View Help File Home A Xu Formulas Data 10-AA Review EE LOCO . Wrap Test " formatting Table Styles Clipboard 1 Question 4: CHART Avl Points: Your Points 3 Directions 4 1) Create an Embedded Column Chart comparing 2008 and 2009 Sales Data for each salesperson Place the chart to the right of the table below and set it up as follows: a) Salesperson name should be located on the x-axis, year should appear in the legend 7 a) Chart Title: 2008/2009 Sales Performance 8 b) and Located on Bottom Total 14 11 12 Abrams, Sally 13 Boer, Budky 14 Gomez, John 15 Jackson, Rob 16 Keyes, Tracy 2008 2,405,739 1,543,649 1.995,975 2,543,706 1,234,945 2019 2,250,789 2,067,054 1,544,856 1,098,557 2,368,523 Question 1 Question 2 Question 3 Question 4 Question 5 TOTAL GRADE
Step by Step Solution
There are 3 Steps involved in it

Get step-by-step solutions from verified subject matter experts