

Question: [Insert Table 3] Abnormal returns in Table 3 corroborate the raw return findings of Table 2.14 In particular, starting with six-month holding periods, mean returns
![[Insert Table 3] Abnormal returns in Table 3 corroborate the raw](https://dsd5zvtm8ll6.cloudfront.net/si.experts.images/questions/2024/10/66fe6e3f6c95f_39866fe6e3ece5a0.jpg)
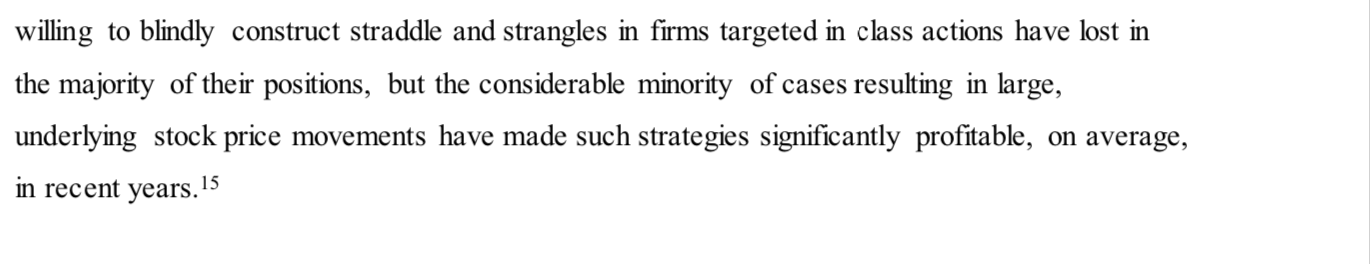

[Insert Table 3] Abnormal returns in Table 3 corroborate the raw return findings of Table 2.14 In particular, starting with six-month holding periods, mean returns are generally positive and 14 Given the consistency of Table 2 results, and that sample size does not greatly decline with larger minimum open- interest requirements, Table 3 results consider a minimum of 100 call and 100 put contracts to formall ATM, statistically significant, even after controlling for market performance. As a specific example, at the six-month holding period length, the longest horizon strategies (like those seen in Panel A of Table 2) give highly significant strategy returns of 6.6%, 7.7%, and 11.1% for ATM, OTMI and OTM2 positions, respectively. The shortest horizon strategies (like those seen in Panel of Table 3) give significant strategy returns of 8.2%, 6.9%, and 14.4% for ATM, OTMI, and OTM2 positions, respectively. Generally, with a set holding time (like the aforementioned example of a six-month return) position returns are greater for shorter-term horizons, perhaps due to lower initial investment levels. Conversely, larger, longer-term significant returns can of course only be realized by buying options with longer times until expiration. For example, significant mean abnormal returns of 9.4%, 10.0%, and 15.7% of ATM, OTMI, and OTM2 positions, respectively, are seen for 1.5-year holding periods of positions formed on class action dates with options between 1.5 and 2 years until expiration. The overall impression of our results remains after considering our control approach. Specifically, evidence persists that markets do not appreciate the sometimes highly dichotomous nature of stock performances of firms in the mid-to-long term wake of a class action. Investors willing to blindly construct straddle and strangles in firms targeted in class actions have lost in willing to blindly construct straddle and strangles in firms targeted in class actions have lost in the majority of their positions, but the considerable minority of cases resulting in large, underlying stock price movements have made such strategies significantly profitable, on average, in recent years.15 OTM1 Table 3: Adjusted, matched-pair, long straddle/strangle returns This table presents a matched-pair approach which calculates returns and significance levels of ATM, OTMI, and OTM2 positions on a relative basis. NYSE, NASDAQ or AMEX listings are required. Then, foreach class action observation in the sample, on the day of the class action allOptionmetrics firms are considered with at least 100 call and put contracts available ofidentical time untilexpiration as the class action firm. Each potential control firm is ranked based on closeness to the market capitalization (size) of the class action firm on the class action date. Each potential control firm is also ranked based on closeness to the average implied volatility of ATM calls and puts of the class action firm on the class action date (with "I" being the potential control firm closesttotheclass action firm's ATM call and put average implied volatility). The potential control firm with the smallest sumofsize and implied volatility ranks is declared to be the matched-pair control firm for the class action observation. Abnormal returns for class action firmoption strategies ATM, OTM1, and OTM2 (for various holding periods) are subsequently calculated by subtracting the analogous, respective ATM, OTMI, and OTM2 returns of the matched -pair control firms. Significance levels, relative to a return of zero, are calculated based on these abnormal returns. Sample firms are gathered based on class actions filed between 1996 and June, 2015, and returns data are utilized through year-end 2016. Panel A: Create position with most Panel B: Create position with most Panel C: Create position with most available available days until expiration, 1.5-2 years available days until expiration, 1-1.5years days untilexpiration, 0.5-1 years ATM OTM1 OTM2 ATM OTM2 ATM OTM1 OTM2 1-Month Ret Mean 0.012 0.017 0.007 0.011 0.015 0.015 0.005 0.029 -0.012 159 136 107 165 151 110 316 303 245 2-Month Ret Mean 0.028* 0.034* 0.055** 0.014 0.019 0.022 0.004 0.009 0.017 158 135 105 164 151 102 313 299 242 4-Month Ret Mean 0.013 0.019 0.049 0.003 0.016* 0.029 0.041 0.061* 0.029 154 135 105 158 146 102 305 290 236 6-Month Ret Mean 0.066** 0.077*** 0.111*** 0.055* 0.066** 0.109* 0.082*** 0.069* 0.144** 153 132 104 157 146 102 266 255 224 9-Month Ret Mean 0.059** 0.041 0.089* 0.060** 0.072* 0.117** n 148 127 102 156 145 101 1-Year Ret Mean 0.091*** 0.089** 0.125** 0.088** 0.133*** 0.135* 144 125 154 143 100 1.5-Year Ret Mean 0.094** 0.100* 0.157** 140 120 95 n n n n n 99 n 3. The article entertains a matching exercise that aims to control for time-varying market conditions. How does controlling for time-varying market conditions help support the paper's results? [word limit: 300; 2pts] [Insert Table 3] Abnormal returns in Table 3 corroborate the raw return findings of Table 2.14 In particular, starting with six-month holding periods, mean returns are generally positive and 14 Given the consistency of Table 2 results, and that sample size does not greatly decline with larger minimum open- interest requirements, Table 3 results consider a minimum of 100 call and 100 put contracts to formall ATM, statistically significant, even after controlling for market performance. As a specific example, at the six-month holding period length, the longest horizon strategies (like those seen in Panel A of Table 2) give highly significant strategy returns of 6.6%, 7.7%, and 11.1% for ATM, OTMI and OTM2 positions, respectively. The shortest horizon strategies (like those seen in Panel of Table 3) give significant strategy returns of 8.2%, 6.9%, and 14.4% for ATM, OTMI, and OTM2 positions, respectively. Generally, with a set holding time (like the aforementioned example of a six-month return) position returns are greater for shorter-term horizons, perhaps due to lower initial investment levels. Conversely, larger, longer-term significant returns can of course only be realized by buying options with longer times until expiration. For example, significant mean abnormal returns of 9.4%, 10.0%, and 15.7% of ATM, OTMI, and OTM2 positions, respectively, are seen for 1.5-year holding periods of positions formed on class action dates with options between 1.5 and 2 years until expiration. The overall impression of our results remains after considering our control approach. Specifically, evidence persists that markets do not appreciate the sometimes highly dichotomous nature of stock performances of firms in the mid-to-long term wake of a class action. Investors willing to blindly construct straddle and strangles in firms targeted in class actions have lost in willing to blindly construct straddle and strangles in firms targeted in class actions have lost in the majority of their positions, but the considerable minority of cases resulting in large, underlying stock price movements have made such strategies significantly profitable, on average, in recent years.15 OTM1 Table 3: Adjusted, matched-pair, long straddle/strangle returns This table presents a matched-pair approach which calculates returns and significance levels of ATM, OTMI, and OTM2 positions on a relative basis. NYSE, NASDAQ or AMEX listings are required. Then, foreach class action observation in the sample, on the day of the class action allOptionmetrics firms are considered with at least 100 call and put contracts available ofidentical time untilexpiration as the class action firm. Each potential control firm is ranked based on closeness to the market capitalization (size) of the class action firm on the class action date. Each potential control firm is also ranked based on closeness to the average implied volatility of ATM calls and puts of the class action firm on the class action date (with "I" being the potential control firm closesttotheclass action firm's ATM call and put average implied volatility). The potential control firm with the smallest sumofsize and implied volatility ranks is declared to be the matched-pair control firm for the class action observation. Abnormal returns for class action firmoption strategies ATM, OTM1, and OTM2 (for various holding periods) are subsequently calculated by subtracting the analogous, respective ATM, OTMI, and OTM2 returns of the matched -pair control firms. Significance levels, relative to a return of zero, are calculated based on these abnormal returns. Sample firms are gathered based on class actions filed between 1996 and June, 2015, and returns data are utilized through year-end 2016. Panel A: Create position with most Panel B: Create position with most Panel C: Create position with most available available days until expiration, 1.5-2 years available days until expiration, 1-1.5years days untilexpiration, 0.5-1 years ATM OTM1 OTM2 ATM OTM2 ATM OTM1 OTM2 1-Month Ret Mean 0.012 0.017 0.007 0.011 0.015 0.015 0.005 0.029 -0.012 159 136 107 165 151 110 316 303 245 2-Month Ret Mean 0.028* 0.034* 0.055** 0.014 0.019 0.022 0.004 0.009 0.017 158 135 105 164 151 102 313 299 242 4-Month Ret Mean 0.013 0.019 0.049 0.003 0.016* 0.029 0.041 0.061* 0.029 154 135 105 158 146 102 305 290 236 6-Month Ret Mean 0.066** 0.077*** 0.111*** 0.055* 0.066** 0.109* 0.082*** 0.069* 0.144** 153 132 104 157 146 102 266 255 224 9-Month Ret Mean 0.059** 0.041 0.089* 0.060** 0.072* 0.117** n 148 127 102 156 145 101 1-Year Ret Mean 0.091*** 0.089** 0.125** 0.088** 0.133*** 0.135* 144 125 154 143 100 1.5-Year Ret Mean 0.094** 0.100* 0.157** 140 120 95 n n n n n 99 n 3. The article entertains a matching exercise that aims to control for time-varying market conditions. How does controlling for time-varying market conditions help support the paper's results? [word limit: 300; 2pts]
Step by Step Solution
There are 3 Steps involved in it

Get step-by-step solutions from verified subject matter experts