

Question: Insert Table Chart Text Shape Media Comment Colla Pendulum Physical Lab Data Table A (11 Points) Length Deflection Angle Number of pennies Time for 10
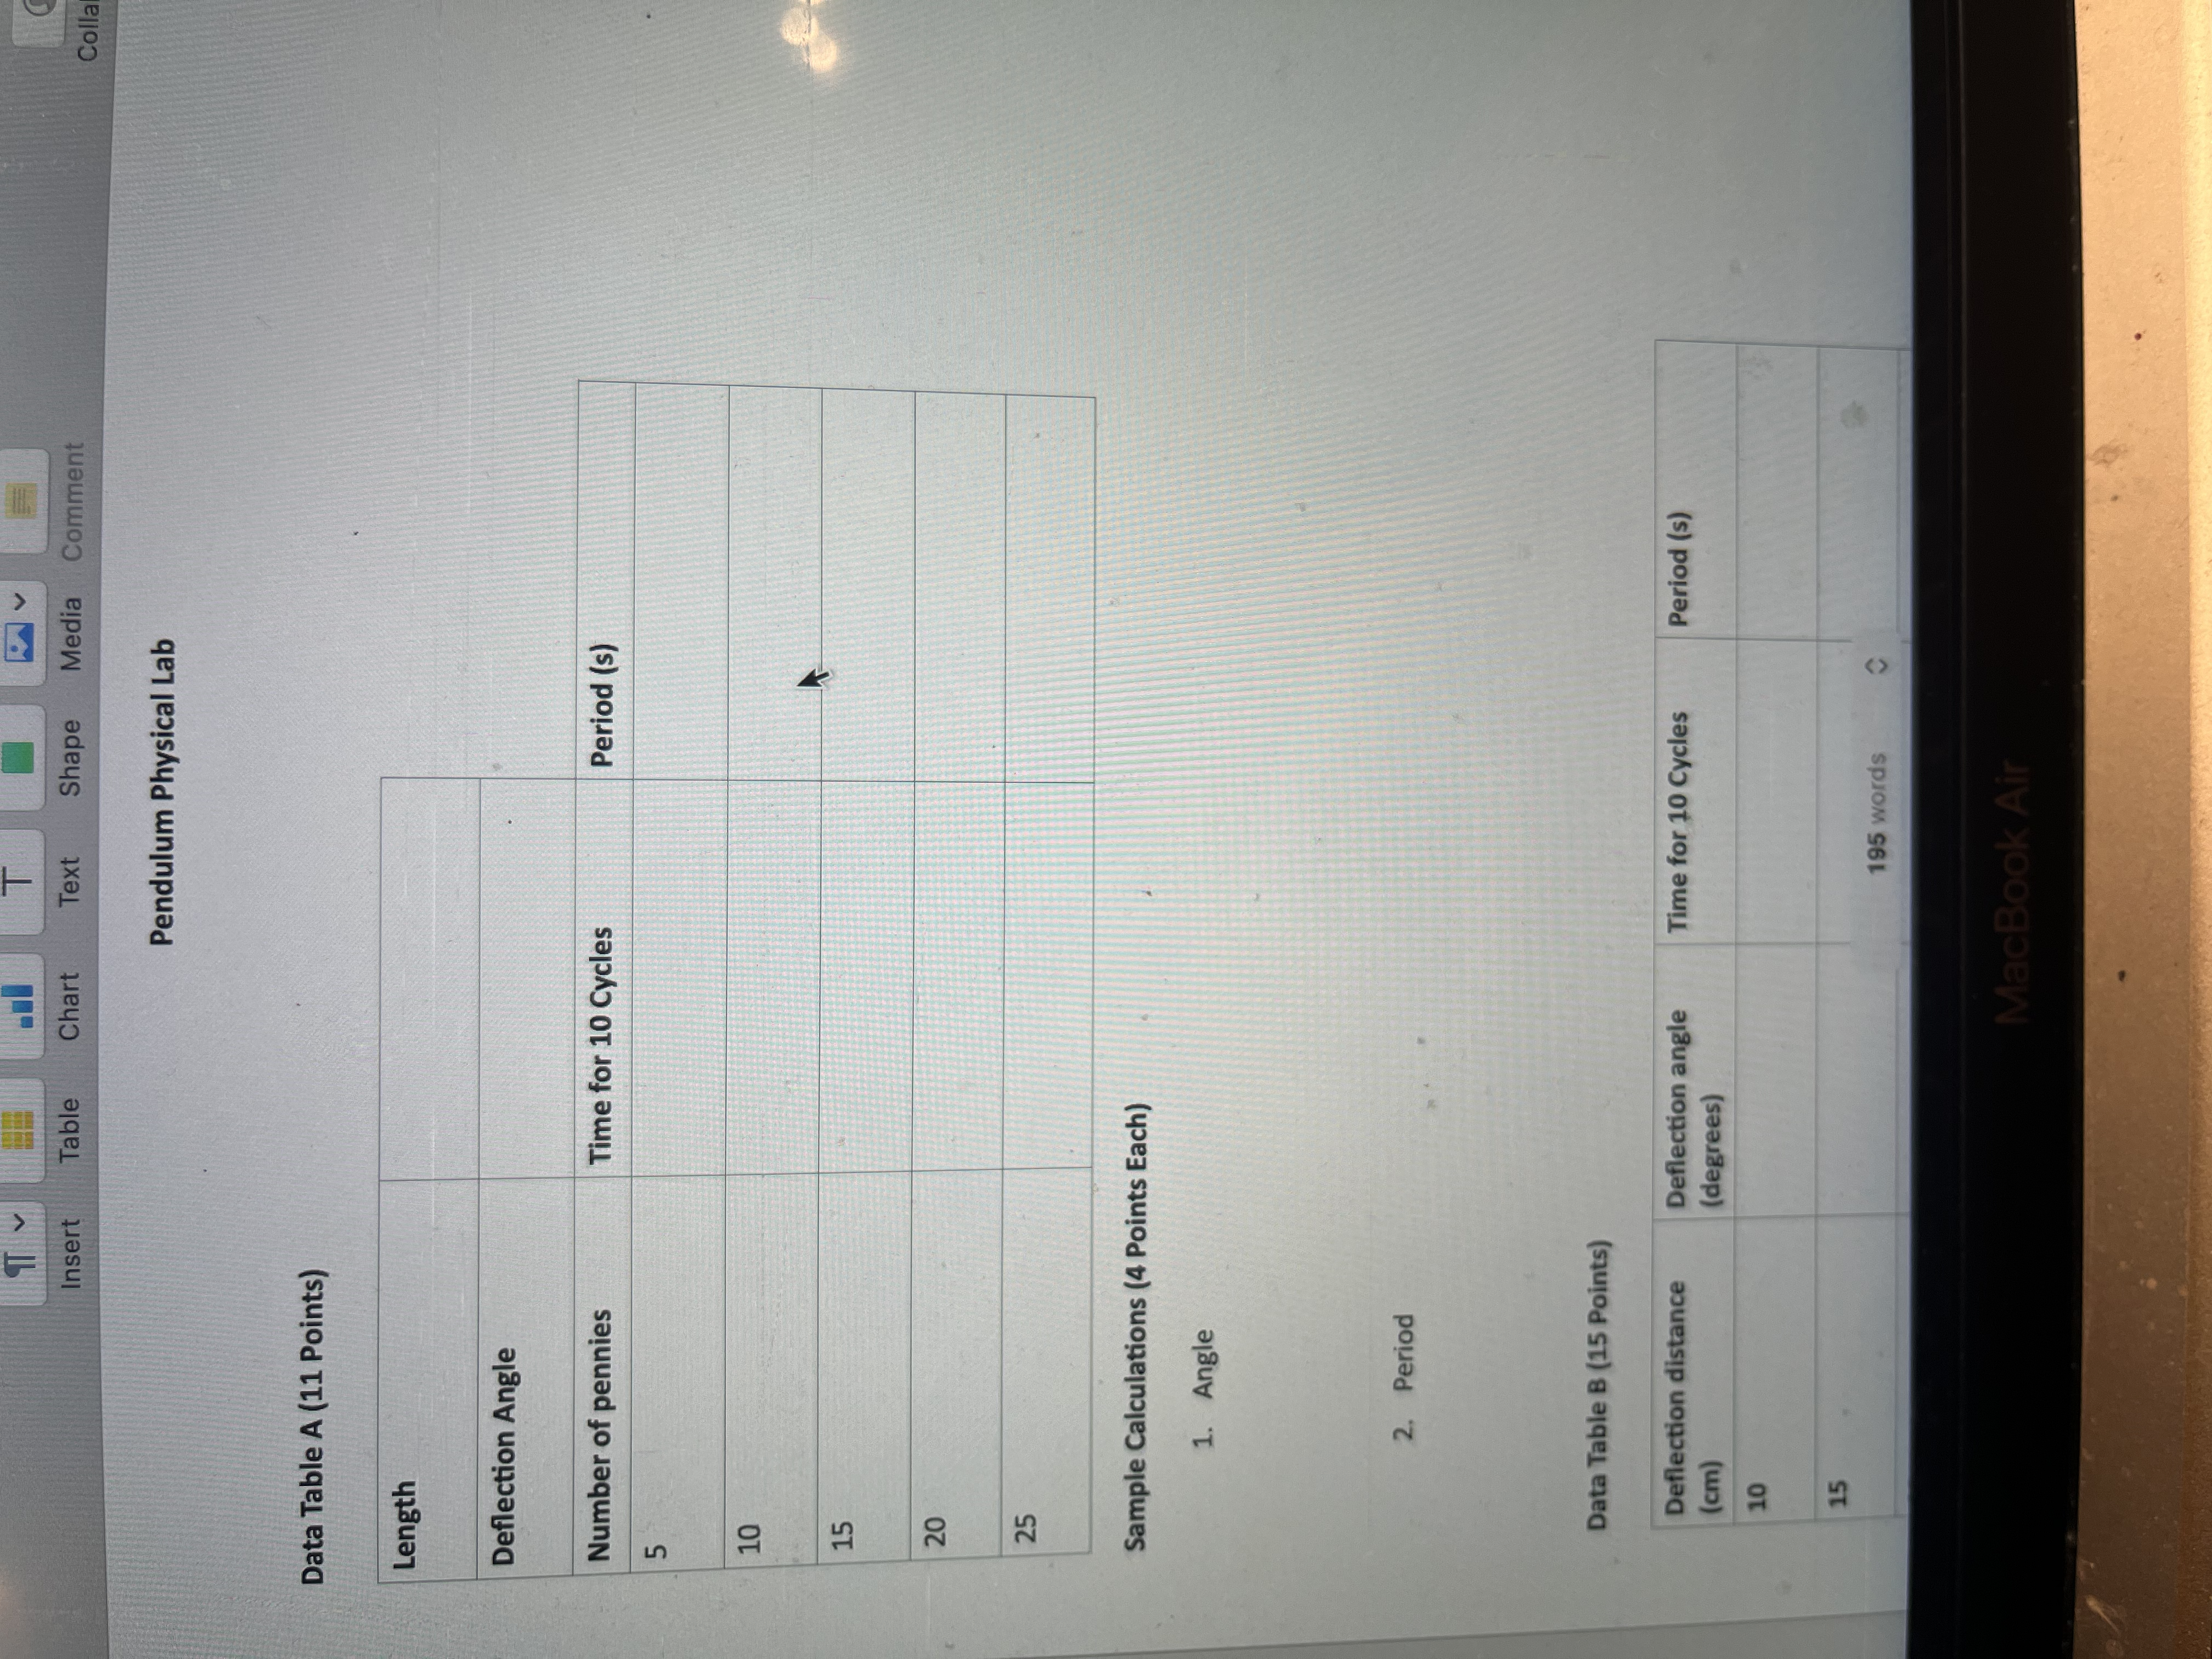
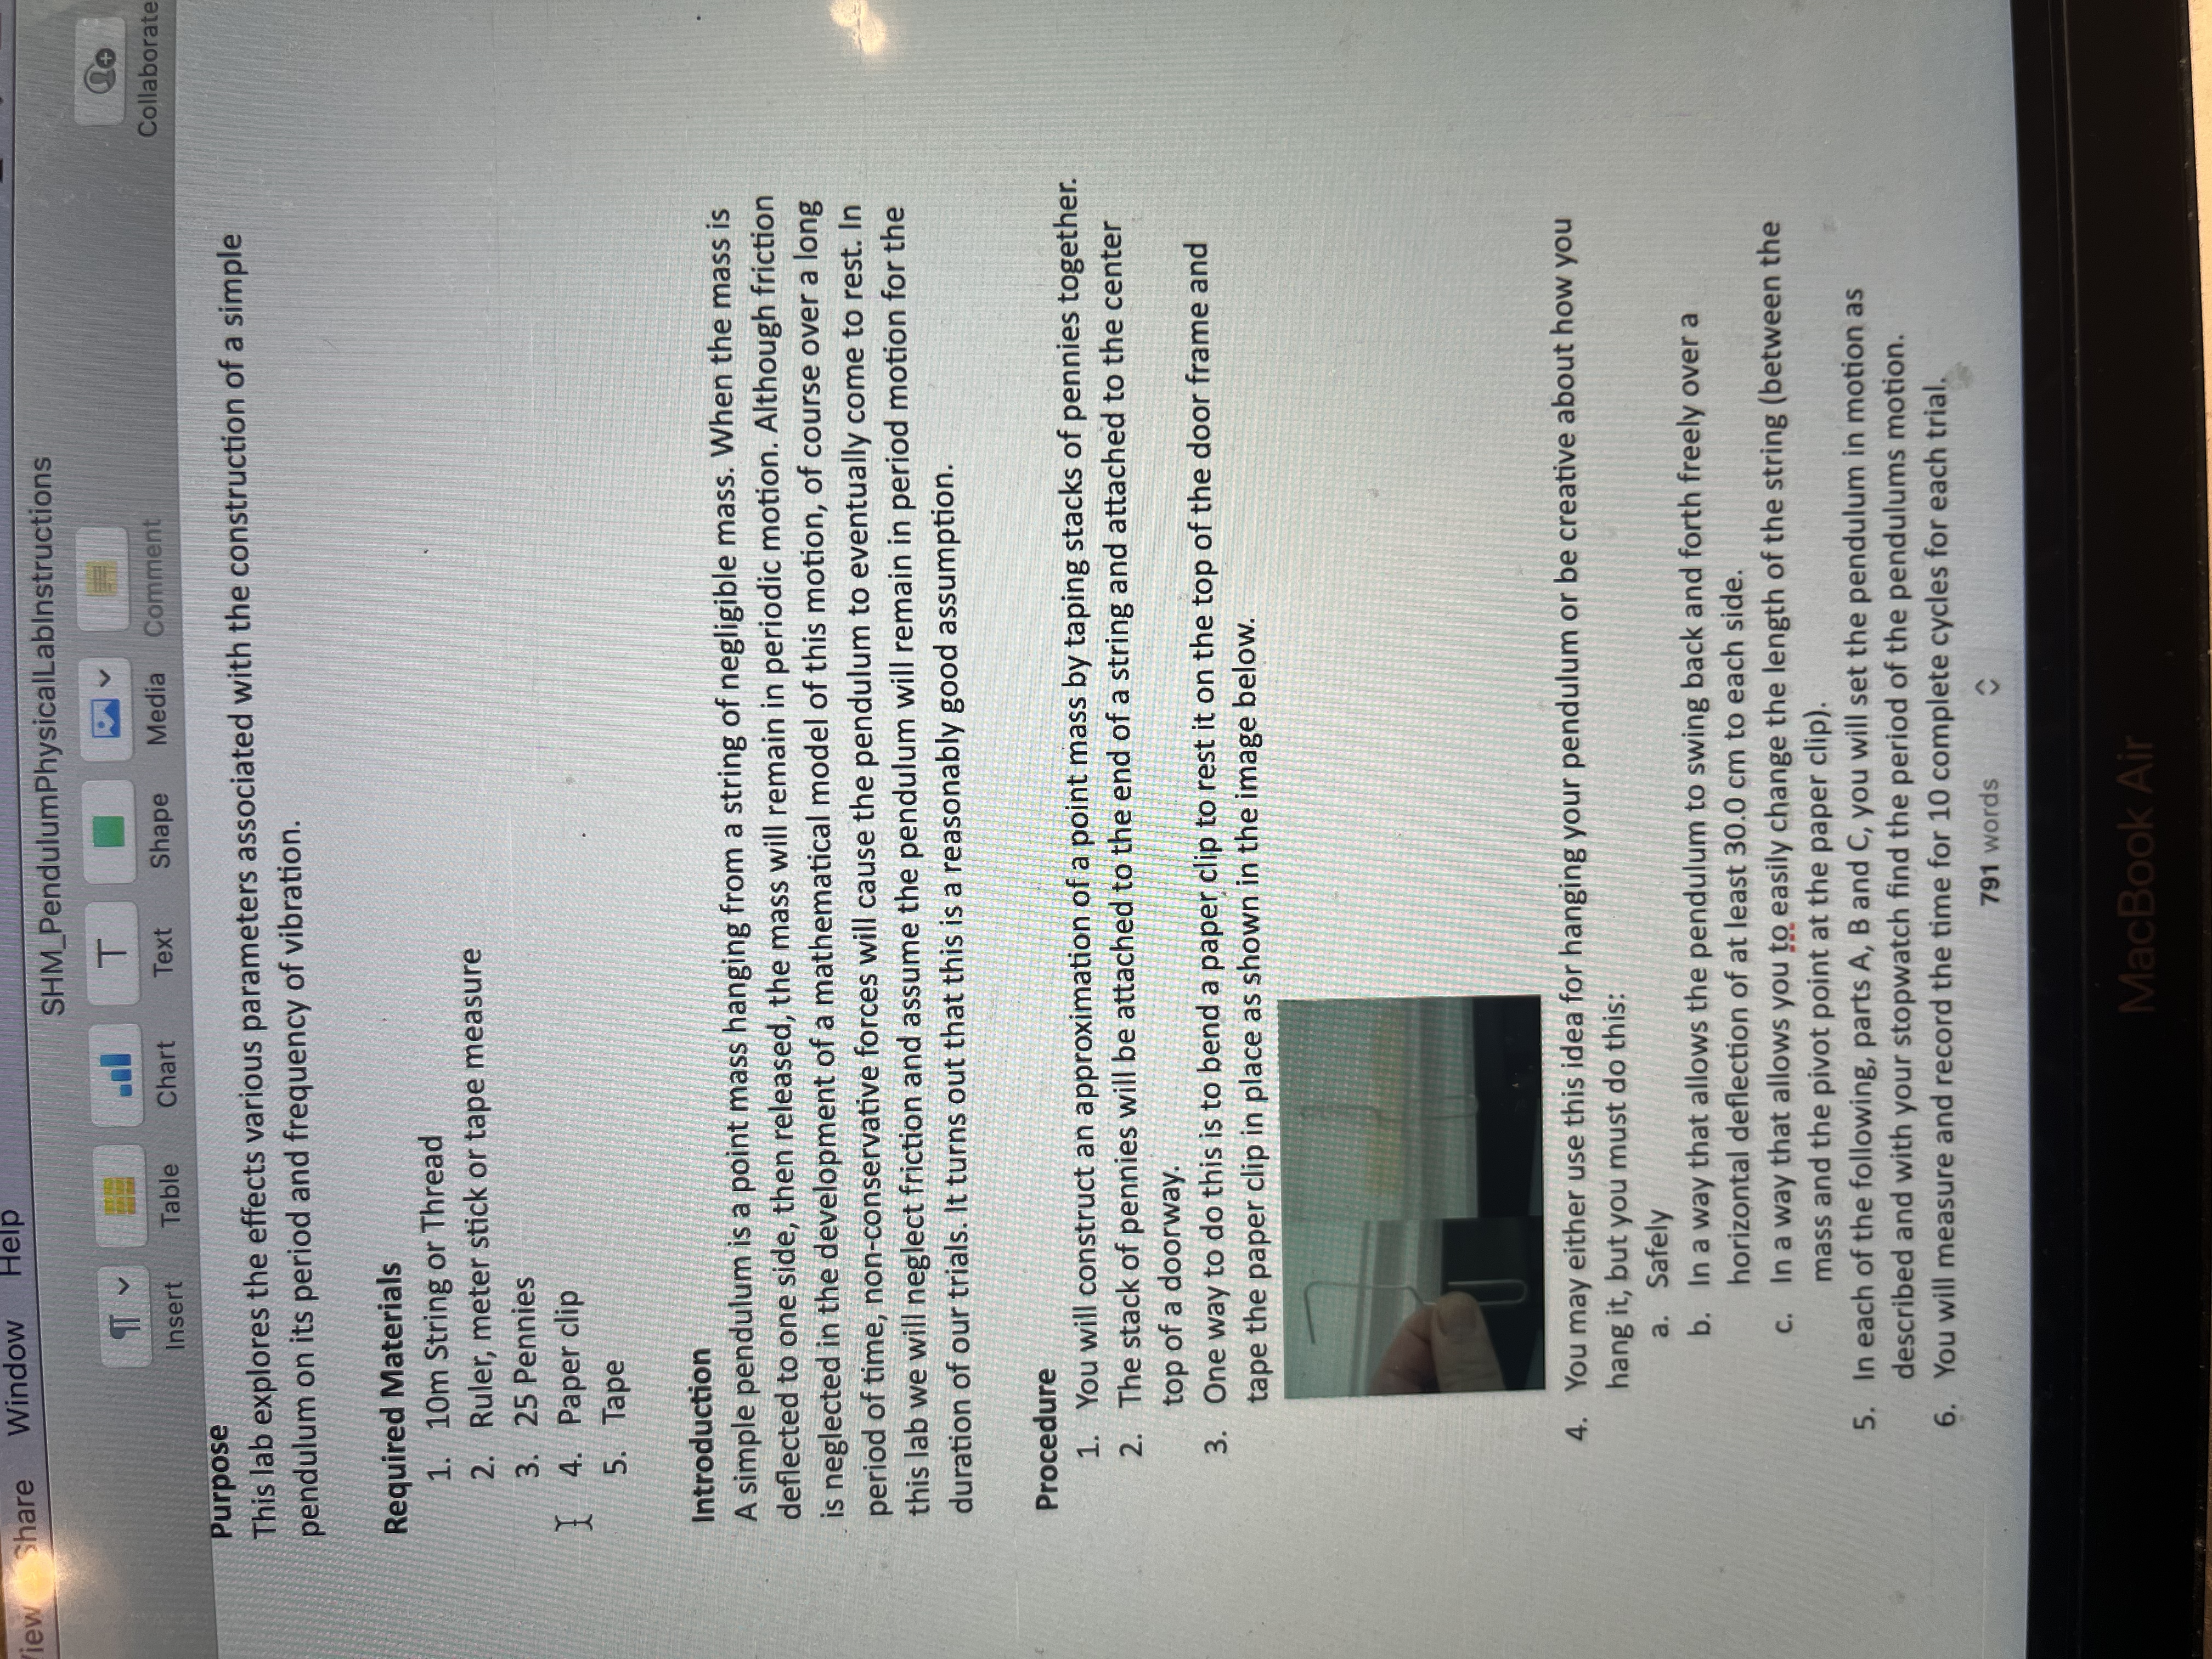
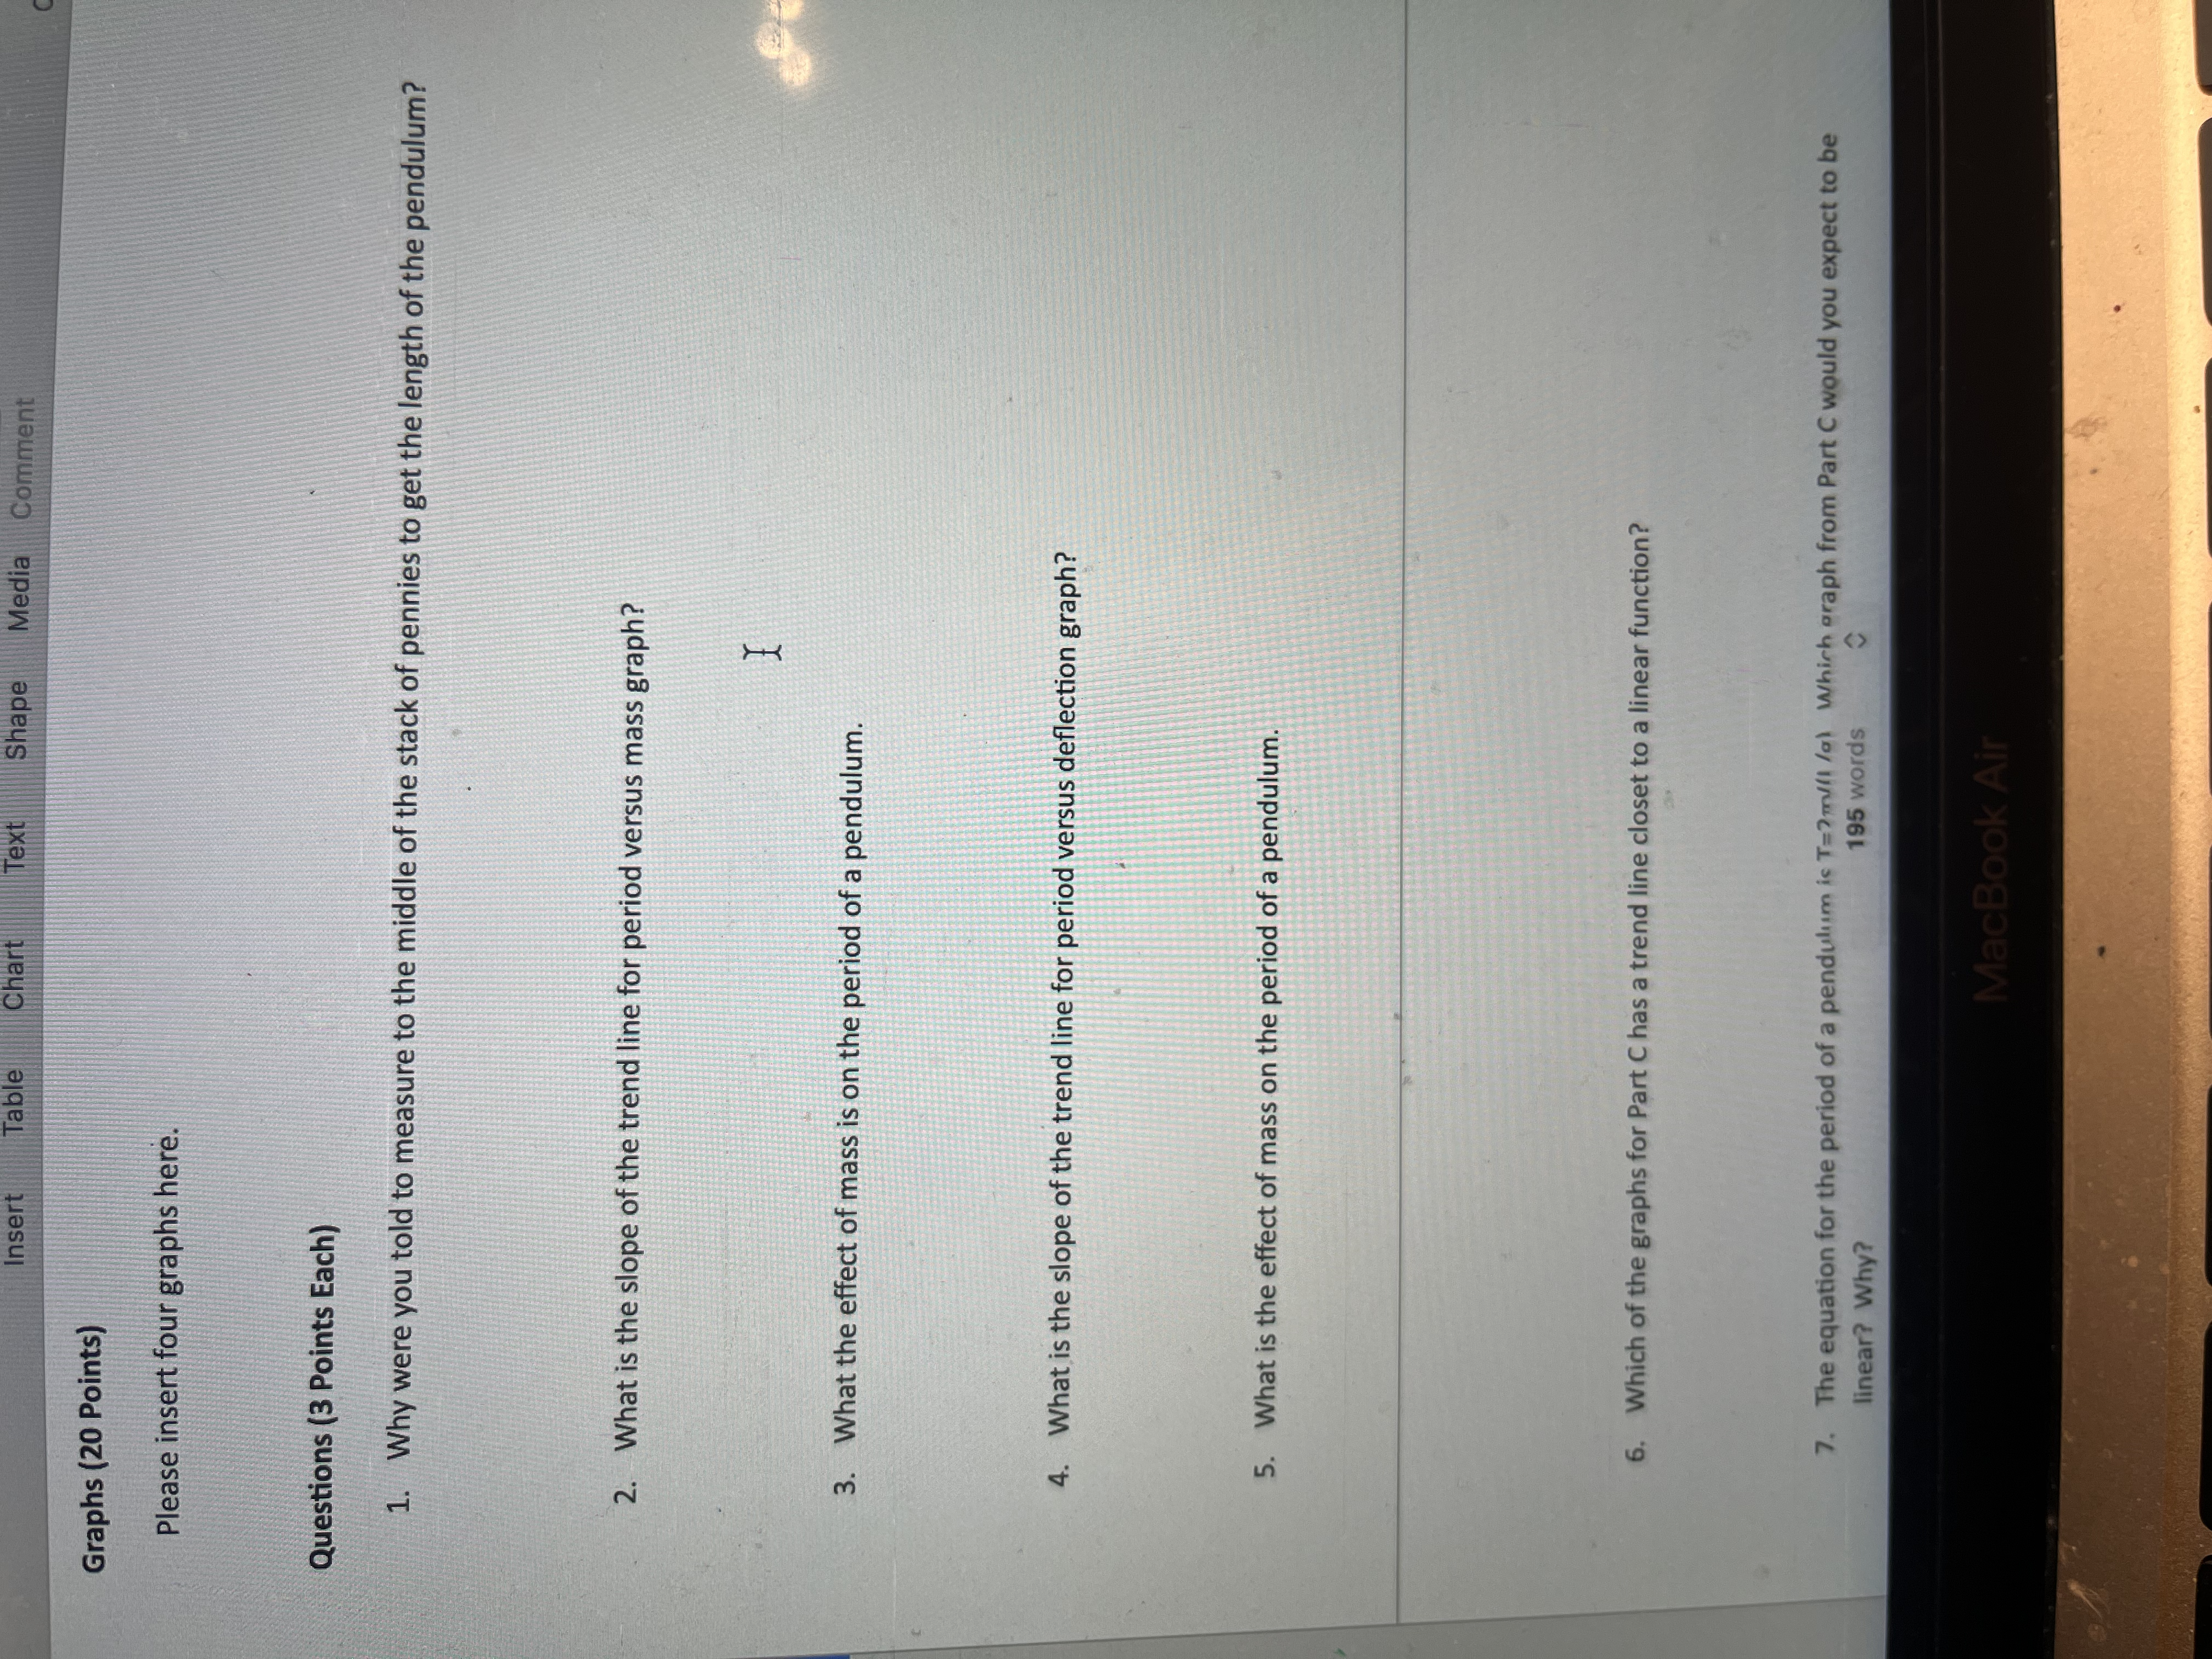
Insert Table Chart Text Shape Media Comment Colla Pendulum Physical Lab Data Table A (11 Points) Length Deflection Angle Number of pennies Time for 10 Cycles Period (s) Sample Calculations (4 Points Each) 1. Angle 2. Period Data Table B (15 Points) Deflection distance Deflection angle Time for 10 Cycles Period (s) (cm) (degrees) 10 15 195 words (> MacBook Air26. Calculate the period for each trial. Part C. Length exploration 27. Start the experiment with the string length and mass unchanged from Part B. 28. Use a 30cm deflection to measure the time for 10 cycles. 29. Shorten the string by 0.30m and repeat. 30. Continue to shorten the string by 0.30m increments and gathering data until you have 5 trials Graph 31. You will create four graphs a. Using data from part A - Number of pennies (relative mass) (x axis) vs Period b. Using data from part B - Angle (x axis) vs Period c. Using data from part C -Length (x axis) vs Period d. Using data from part C-Square Root Length (x axis) vs Period 32. Please make sure graphs are completed following course expectations. Questions - Answer the questions found on the submission form Conclusion - Write a conclusion using the criteria given to you by your teacher 791 words MacBook Air DII DD 1 2 F4 F6iew Share Window Help SHM_PendulumPhysicalLabinstructions F Insert Table Chart Text Shape Media Comment Collaborate Purpose This lab explores the effects various parameters associated with the construction of a simple pendulum on its period and frequency of vibration. Required Materials 1. 10m String or Thread 2. Ruler, meter stick or tape measure 3. 25 Pennies I 4. Paper clip 5. Tape Introduction A simple pendulum is a point mass hanging from a string of negligible mass. When the mass is deflected to one side, then released, the mass will remain in periodic motion. Although friction is neglected in the development of a mathematical model of this motion, of course over a long period of time, non-conservative forces will cause the pendulum to eventually come to rest. In this lab we will neglect friction and assume the pendulum will remain in period motion for the duration of our trials. It turns out that this is a reasonably good assumption. Procedure 1. You will construct an approximation of a point mass by taping stacks of pennies together. 2. The stack of pennies will be attached to the end of a string and attached to the center top of a doorway. 3. One way to do this is to bend a paper clip to rest it on the top of the door frame and tape the paper clip in place as shown in the image below. 4. You may either use this idea for hanging your pendulum or be creative about how you hang it, but you must do this: a. Safely b. In a way that allows the pendulum to swing back and forth freely over a horizontal deflection of at least 30.0 cm to each side. c. In a way that allows you to easily change the length of the string (between the mass and the pivot point at the paper clip). 5. In each of the following, parts A, B and C, you will set the pendulum in motion as described and with your stopwatch find the period of the pendulums motion. 6. You will measure and record the time for 10 complete cycles for each trial. 791 words MacBook AirInsert Table Chart Text Shape Media Comment Graphs (20 Points) Please insert four graphs here. Questions (3 Points Each) 1. Why were you told to measure to the middle of the stack of pennies to get the length of the pendulum? 2. What is the slope of the trend line for period versus mass graph? 3. What the effect of mass is on the period of a pendulum. 4. What is the slope of the trend line for period versus deflection graph? 5. What is the effect of mass on the period of a pendulum. 6, Which of the graphs for Part C has a trend line closet to a linear function? 7. The equation for the period of a pendulum is T=?m/(1 /a) Which graph from Part C would you expect to be linear? Why? 195 words MacBook AirView Share Window Help SHM_PendulumPhysicalLabinstructions Insert Table Chart Text Shape Media Comment 7. You will then divide the number value by 10 get the period. This will eliminate some possible sources of error with timing the period. 8. One cycle is the time to move from the release point and return back to the release point. . Be careful to not count "one" just as the pendulum is release; this is "zero". Count "one" when the pendulum returns after one full cycle. If you miss the first cycle, it is not a problem, just start timing on the next cycle Part A. Mass exploration 10. Tape a stack of 5 pennies together and attach them to the end of the string. 11. Hang the pennies from the paper clip so that the string is approximately 1.8 meters long. You do not have to make the string exactly 1.8 meters 12. Record the length as the distance from the pivot at the top to the middle of the stack of pennies in data table A 13. This Distance should remain constant throughout this part of the experiment. 14. Allow the pennies to come to rest. This is the equilibrium position. 15. Deflect the pennies to one side a distance of 30cm from equilibrium. This distance should remain constant for the entire lab 16. Calculate the angle from vertical and show your calculation in the area provided. 17. Release the pendulum and record the time to 10 complete cycles. 18. Repeat the experiment with 10, 15,20, and 25 pennies. 19. Calculate the period for each trial. Show a sample of your calculation in the area provided. Part B. Deflection exploration 20. Leave the length of the string constant from Part A 21. Leave 25 pennies at the end of the string. 22. In this trial, you will deflect pennies from 10cm, 15cm, 20cm, 25cm, and 30cm. 23. Calculate the angle using your deflection and the length of the string and record data table B 24. Release the pendulum and record the time for 10 cycles. 25. Repeat for the other 4 deflection distance. 26. Calculate the period for each trial. Part C. Length exploration 27. Start the experiment with the string length and mass unchanged from Part B. 28. Use a 30cm deflection to measure the time for 10 cycles 29. Shorten the string by 0.30m and repeat. 30. Continue to shorten the string by 0.30m increments and gathering data until you have 5 trials. Graph 791 words (>
Step by Step Solution
There are 3 Steps involved in it

Get step-by-step solutions from verified subject matter experts