

Question: Instruction: I need a tutor who can answer this correctly. Show your solutions. 1. The graph below shows the position vs time for an object
Instruction: I need a tutor who can answer this correctly. Show your solutions.
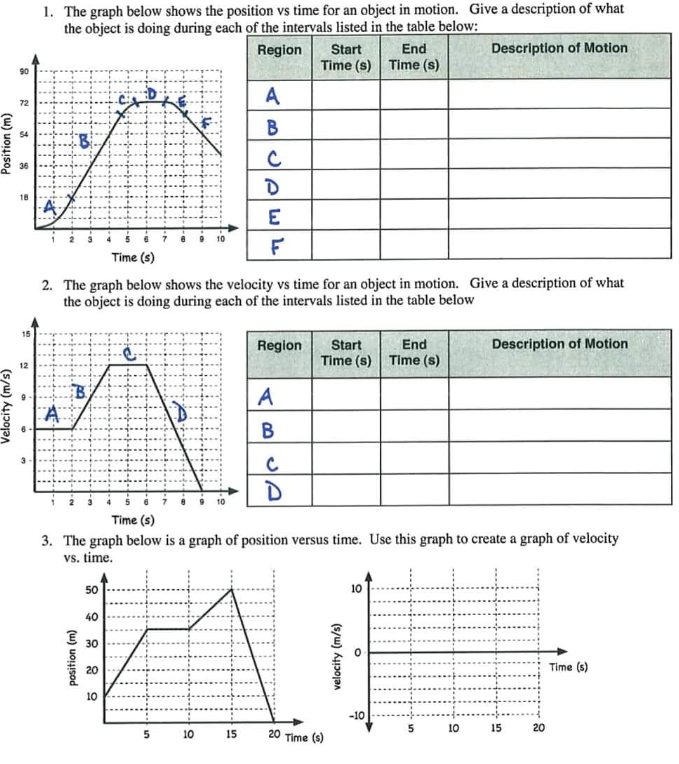
1. The graph below shows the position vs time for an object in motion. Give a description of what the object is doing during each of the intervals listed in the table below: Region Start End Description of Motion Time (s) Time (S) A B Position (m) C D E F Time (s) 2. The graph below shows the velocity vs time for an object in motion. Give a description of what the object is doing during each of the intervals listed in the table below 15 Region Start End Description of Motion 12 Time (s) Time (s) A Velocity (m/s) B D Time (s) 3. The graph below is a graph of position versus time. Use this graph to create a graph of velocity vs. time. 50 10 40 30 velocity (m/s) position (m) 20 Time (s) 10 -10 10 15 20 10 15 20 Time (s)
Step by Step Solution
There are 3 Steps involved in it

Get step-by-step solutions from verified subject matter experts